

1. Introduction
2. Materials and Methods
2.1 Study area and specification
2.2 K-LIDM
3. Results
3.1 Storage capacity calculation
3.2 Hydrological analysis
3.3 Model analysis
3.4 Calibration & verification of model
4. Discussion
1. Introduction
In the past few decades, Korea has undergone fervent industrialization and urbanization. These urban developments increased the ratio of impervious areas, increasing the amount of stormwater runoff. Cities usually have intensive stormwater management systems that quickly drain stormwater through conduits, which affects various hydrological factors such as peak flow, travel time, and lag time. Distorted water cycle systems cause problems such as drying of streams, groundwater depletion and water pollution. In addition, climate change tends to increase the frequency of abnormal rainfall to occasionally cause water disasters, including urban floods in the summer, typhoons in the rainy season; all of these have adverse effects on people and property. To solve these problems, LID (Low Impact Development) technique is widely regarded as a suitable option to transition from conventional intensive stormwater management to a distributed form of urban stormwater management.
Shafique and Kim (2017), Bradford and Denich (2007), and Eckart et al. (2017) are distributed superior management methods that minimize runoff by infiltrating and storing LID in the superiority of rainfall sources. Infiltration water restores the water cycle to its natural state through the process of groundwater recharge. In addition, it is possible to reduce outflow by installing vegetation or permeable pavements on existing impervious areas such as roads, parking lots and rooftops, which is the main purpose of LID. LID involves various elementary technologies, and LID facilities can be largely classified into infiltration and storage, based on function. Currently, studies on LID are being conducted in developed regions across the US and Europe; interest in LID is also increasing in Korea. Lee and Kwak (2008) has shown related variables such as peak flow rate, reservoir size, discharge structure size, maximum allowable water depth, and rectangular bottom areas and trapezoidal bottom areas for simplified design of reservoirs; simple procedures of their design have also been reported. Yoo et al. (2010) quantifies the effect of reducing the outflow of small-scale storage facilities by estimating the outflow using the modified glass equation and evaluates the efficiency of storage facilities by calculating the ratio of the outflow curve to the size of the storage facility. Studies on reservoirs involved the application of LID as stormwater management incorporated distributed management methods. In addition, studies on the reduction effect of LID facilities on outflow and non-point pollutants have been conducted using various hydrological analysis models (ME, 2010). Through the NRCS-CN method, the direct runoff and infiltration amount in Busan was estimated and analyzed under various scenarios (pre-development, post-development, drainage design, infiltration reservoir design) to propose a complex design technique for the Busan reservoir (Choi et al., 2011). The flow rate curve for maintaining the hydrologic cycle of pre-urban development was determined by constructing small watersheds based on the extent of bioretention (Lee et al., 2016).
In addition, LID elements (green roof and permeable pavement) were applied to urban areas using Storm Water Management Model (SWMM); the runoff and pollutant reduction effects were examined for each scenario (Cho, 2012). They were also analyzed using SUSTAIN and SWMM. Further, the outflow reduction effect was analyzed for various scenarios, by comparing the results when LID facilities such as infiltration trenches, bioretention, and permeable pavements were used (Nam, 2016). This led to the development of K-LIDM, a Korean LID analysis model based on Hydrological Simulation Program-Fortran (HSPF); the application of K-LIDM was proposed by applying various LID technologies (Park, 2018). Based on these studies, a method for analyzing the water cycle efficiency of LID facilities was developed, including a method for optimizing their design. The water cycle effect at the Korea GI & LID (Green Infra & Low Impact Development) Center was analyzed using the K-LIDM model (Jang, 2018). Among the parameters that affect hydrological characteristics, asphalt parking lots, soil type, humidity conditions, and bioretention scale were studied (Davis, 2008; Palhegyi, 2009; Brown and Hunt, 2010). Wet retention was conducted for the analysis of characteristics; five different wet retention ponds were observed at 5-min intervals for 24 h and the ratio of peak inflow, peak outflow and outflow of wet retention ponds was analyzed (Hancock et al., 2010). Based on the DRAINMOD model, the water balance (runoff, drainage, overflow, and exfiltration/ET) of bioretention was analyzed, and sensitive factors such as the ratio between surface area and catchment area, internal water storage area, depth, and soil type were studied (Winston et al., 2016).
The majority of research papers on LID present performance analysis and design criteria for outflow reduction. In addition, the importance of the water cycle is emphasized during the development of new cities through the application of LID techniques. However, a quantitative evaluation of the effect and efficiency of LID facilities has not been performed extensively. To quantitatively evaluate LID facilities, it is necessary to study various conditions such as type, shape, topography, and climate characteristics. Therefore, in this study, we select one of the key technologies in LID facilities and conduct a quantitative evaluation of the water cycle efficiency through hydrological analysis of bioretention-type LID facilities.
2. Materials and Methods
2.1 Study area and specification
The subject of this study is the bioretention-type LID facility in KOREA GI & LID Center of National University, Yangsan Campus (Fig. 1). In this study, we analyzed the water cycle efficiency by conducting an experiment on bioretention among the constitutive technologies of LID facilities. Prior to the discussion of the findings, the concept, characteristics, water cycle system and research equipment are described.
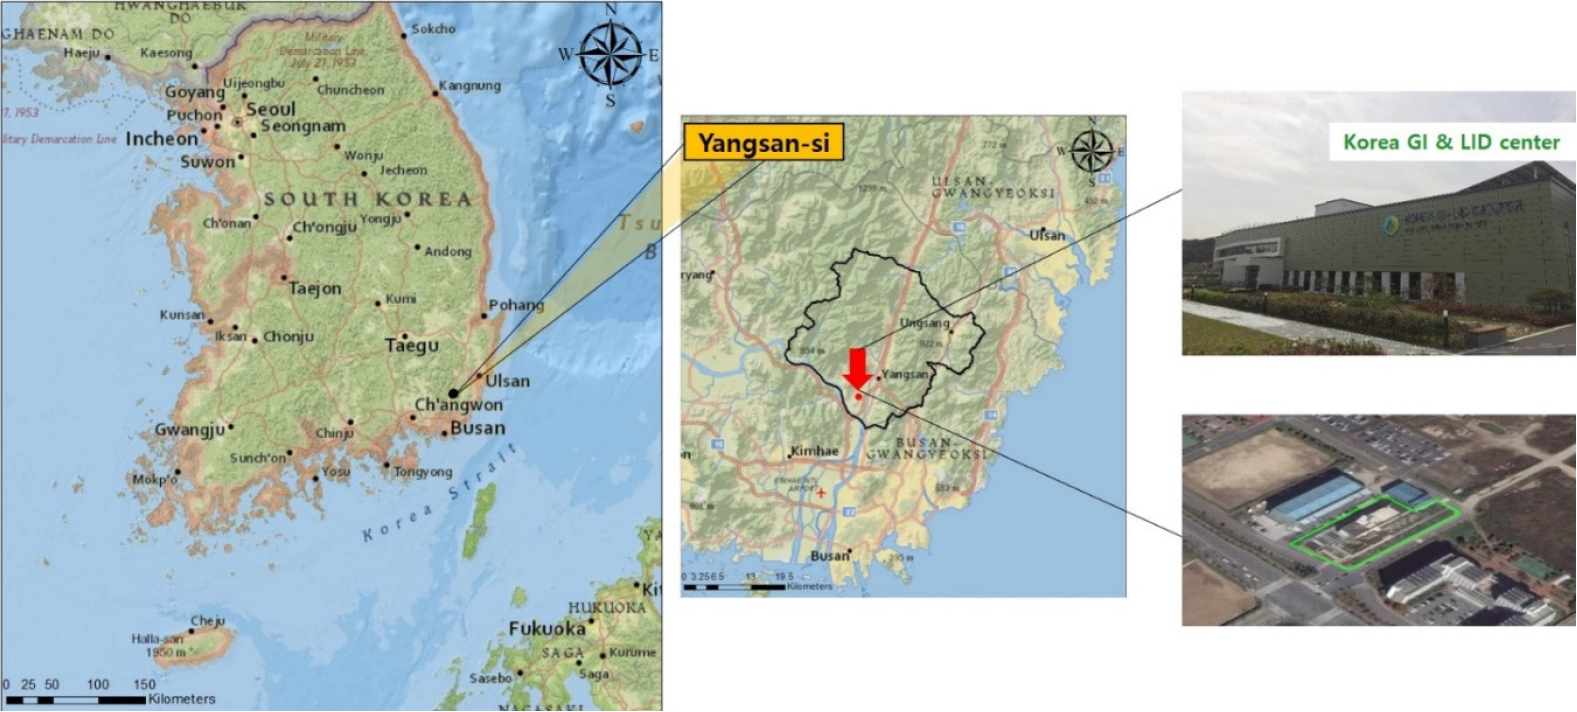
The site area of the Korea GI & LID Center is 4,895 m2, consisting of an indoor laboratory, an educational research center, and an outdoor demonstration complex. The bioretention-type LID facility used in this study is one of the outdoor demonstration facilities. The floor area and the upper area are about 88.30 m2 and 253.44 m2, respectively, and the total storage capacity is approximately 143.21 m3. The watersheds of the bioretention LID facility include those of the rain-garden-type LID facilities and parking-lot-type LID facilities. Fig. 2 shows the bioretention LID facility. The bioretention LID facility consists of a wet retention pond, a dry retention pond and a permeable pavement; the parking-lot-type LID facility consists of 10 parking lots, a check road and vegetation channels; the rain-garden-type LID facility consists of four rain gardens, a check road and a permeable pavement. Table 1 provides the specifications of the watersheds in the bioretention LID facility.

Table 1.
Specifications of bioretention LID watersheds
The bioretention LID facility collects and stores outflow from the watersheds. A hydrological analysis is needed to conduct quantitative studies on the water cycle efficiency of bioretention. Waterproof paper was installed on the floor during the construction process to perform hydrologic analysis. In addition, geocells were installed to prevent loss of vegetation and soil, adding to the stability of the slope. Fig. 3 shows the installed waterproof cloth and geocells.

Stormwater in the watersheds flows into the bioretention unit through the surrounding trench and channel. The collected stormwater is used as the bioretention maintenance water, and it is possible to circulate the bioretention using an internal circulation pump. When the water reaches a certain level, the excess amount is discharged through the overflow pipe. Additionally, in case of emergencies, the water level can be lowered by discharging water through the drainage pump. Fig. 4 shows a schematic of the water cycle of the bioretention unit in the GI & LID Center.

A radar gauge is a non-contact type sensor that can be easily installed on river facilities such as bridges; it measures the water level by irradiating the surface with microwaves. Further, an accurate water level value can be calculated by converting the arrival time of the reflected wave. The radar gauge installed at the bioretention unit measures the water level every minute. This water level information can be checked in real time on a monitoring website (http://210.118.169.18/monitoring/bir). Fig. 5 represents the monitoring system of the bioretention unit. Table 2 provides the specifications of the radar gauge.

Table 2.
Specifications of radar gauge
2.2 K-LIDM
In Korea, there is a growing interest in urban stormwater management and non-point pollution source management. Additionally, there is an increasing demand for hydrological analysis models that are applicable to LID technology. However, due to the constraints involved in domestic scenarios for the successful application and design of LID technologies, there are a limited number of applicable models, such as SWMM, HSPF and Western Washington Hydrology Model (WWHM) (Lee et al., 2016). SWMM is a hydrological model that is used analyze the channel routing of urban watersheds and is widely used to simulate the flow and water quality of urban watersheds. However, the model cannot perform precise hydrological analysis across different LID facilities and gives rise to complications in domestic applications. To solve this problem, K-LIDM, an LID analysis model specific to Korea was developed (Park, 2018). K-LIDM can be used to construct LID facilities in detail, and to analyze stormwater outflow reduction and water cycle effect through inter-facility linkage. The basic runoff simulation of K-LIDM based on HSPF can precisely model flood routing, and this model can be interlocked with SWMM. Compared to other models, this model is especially effective in analyzing the effect of LID techniques and is utilized across various LID facilities. There are 10 applicable LID facilities - porous pavements, bioretention, green roofs, rain tanks, planter boxes, infiltration basins, infiltration trenches, vegetated swales, sand filters, and vegetable filter strips (ME, 2013). All facilities are hydrologically linked and can be used to analyze channel routing to other facilities. K-LIDM has various LID facilities. Among them, infiltration and detention type LID elemental technologies have infiltration trenches, infiltration basins and rain tanks. In this study, we used an infiltration basin facility of the K-LIDM to simulate bioretention. It is a facility designed to collect stormwater outflow at a reservoir, to reduce the direct runoff of stormwater through temporary storage and infiltration, and to remove pollutants. One can enter detailed specifications of the infiltration basin, outflow pipe, and infiltration parameters. Infiltration parameters include infiltration rate, and infiltration through side slope.
3. Results
3.1 Storage capacity calculation
This study involves the calculation of the water cycle efficiency, and analysis of bioretention in the Korea GI & LID Center. The storage capacity was calculated to analyze the water cycle efficiency of bioretention. A constant flow rate was maintained using a hose capable of flow measurement, and the experiment was conducted until overflow occurred through the overflow pipe (Fig. 6). A flow rate of 0.19 m3/min was maintained through the hose. The extent of bioretention was checked and measured through the monitoring system every 10 min.

In this experiment, a flow rate of 0.19 m3/min was set for about 730 min. During this time, the water level in the bioretention unit rose to 0.95 m. The total inflow rate was 136.61 m3, combined with the initial reservoir volume of 6.6 m3; the total storage capacity of the bioretention unit was about 143.21 m3. The storage curves with respect to the water level are shown (Fig. 7).
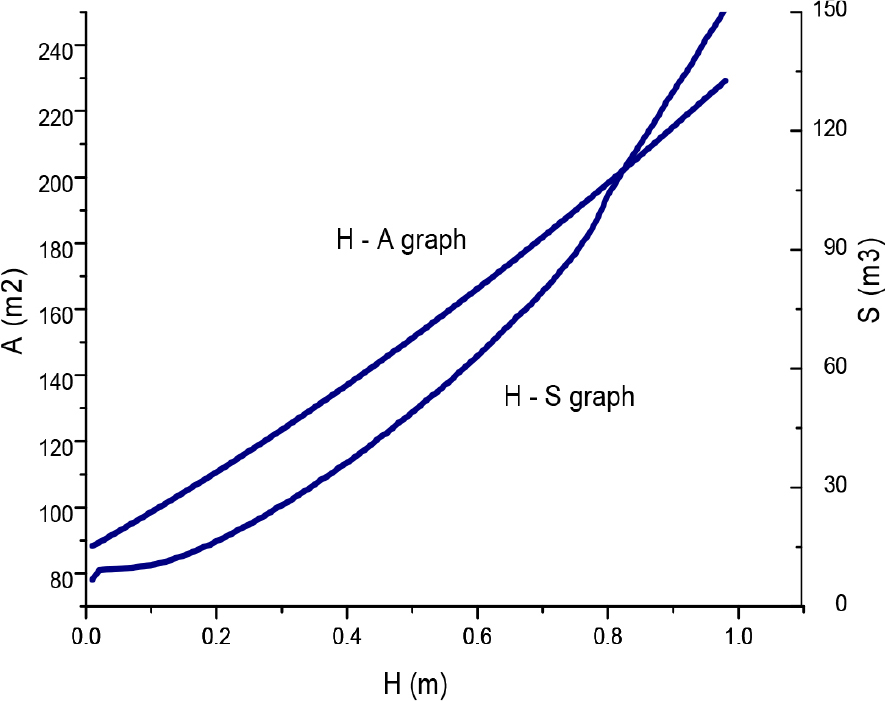
The water level-storage curve equation is as follows.
Using this equation, we can determine the storage capacity of the bioretention unit in the Korea GI & LID Center. The storage and area of the bioretention unit are summarized in Table 3.
Table 3.
Storage and area by water level
| Water Level (m) | Surface Area (m2) | Storage (m3) | |
| Zero Water Level | 0.00 | 88.30 | 6.60 |
| Normal Water Level | 0.45 | 144.09 | 42.70 |
| Full Water Level | 0.95 | 224.03 | 143.21 |
3.2 Hydrological analysis
The rainfall and weather data of the Korea GI & LID Center were measured using a conduction type rainfall meter installed on the roof. This equipment operates in the manner of a tipping bucket (Table 4). When there is precipitation, water drops into the catchment and when the water level exceeds 0.5 mm, tipping occurs. At this time, the amount of rainfall is measured as the bucket moves. Rainfall data measured at 1-min intervals were stored in 1-min, 5-min, 10-min, and 1-h intervals at the monitoring site and could be checked in real time (Fig. 8).
Table 4.
Specifications of rain gauge


Hydrological analysis of the bioretention LID facility was conducted using rainfall and water level data collected through the Korea GI & LID Center monitoring system. In case of rain, water enters the bioretention system, and the water level rises. Subsequently, the storage can be calculated by using the water level-storage curve. Additionally, it is possible to calculate the storage change, by calculating the difference in storage every minute. This change represents inflow into the bioretention unit, the sum of which is the total storage in that rainfall event. This amount represents the outflow reduction of the bioretention LID facility. Eighteen rainfall events were analyzed from September 2017 to October 2018 (Fig. 9) and the amount of water stored in the bioretention unit was calculated for each rainfall event. By analyzing the data, the rainfall-storage relation (Fig. 9) was estimated. Additionally, storage (S) as a function of precipitation (P) was expressed using the logistic model. Using this equation, the storage of the bioretention unit can be predicted using rainfall information. These predictions enable effective water management for bioretention facilities.

3.3 Model analysis
A model was constructed using K-LIDM to analyze the outflow and water cycle of the bioretention watersheds in the Korea GI & LID Center. The facilities in the watershed were divided, the elements of each facility were linked, and the parameters were calculated. Flow in the watershed was introduced according to the water cycle flow diagram, and stormwater was collected at the bioretention unit and discharged. The calibration and verification of the model were conducted using observations from real rainfall events, and simulated values. The K-LIDM model was applied to the bioretention-type LID facility, rain-garden-type LID facility, and the parking-lot-type LID facility. An infiltration basin, and a vegetated swale were included in the bioretention LID facility; a porous pavement, a vegetated swale, and an infiltration trench were added in the parking-lot-type LID facility; a planter box, a sand filter, a porous pavement and an infiltration trench were installed in the rain-garden-type LID facility. Fig. 10 and Tables 5, 6, 7, 8 provide the details of the bioretention watershed model.

Table 5.
LID facility dimensions of the K-LIDM Model
Table 6.
Bioretention LID parameters of the K-LIDM model
| Outlet Structure Date | ||
| Riser Diameter (mm) | Riser Height (m) | |
| BR-WP | 190 | 0.95 |
| BR-DP | 30 | 0.01 |
Table 7.
Parking lot LID parameters of the K-LIDM model
Table 8.
Rain garden LID parameters of the K-LIDM model
3.4 Calibration & verification of model
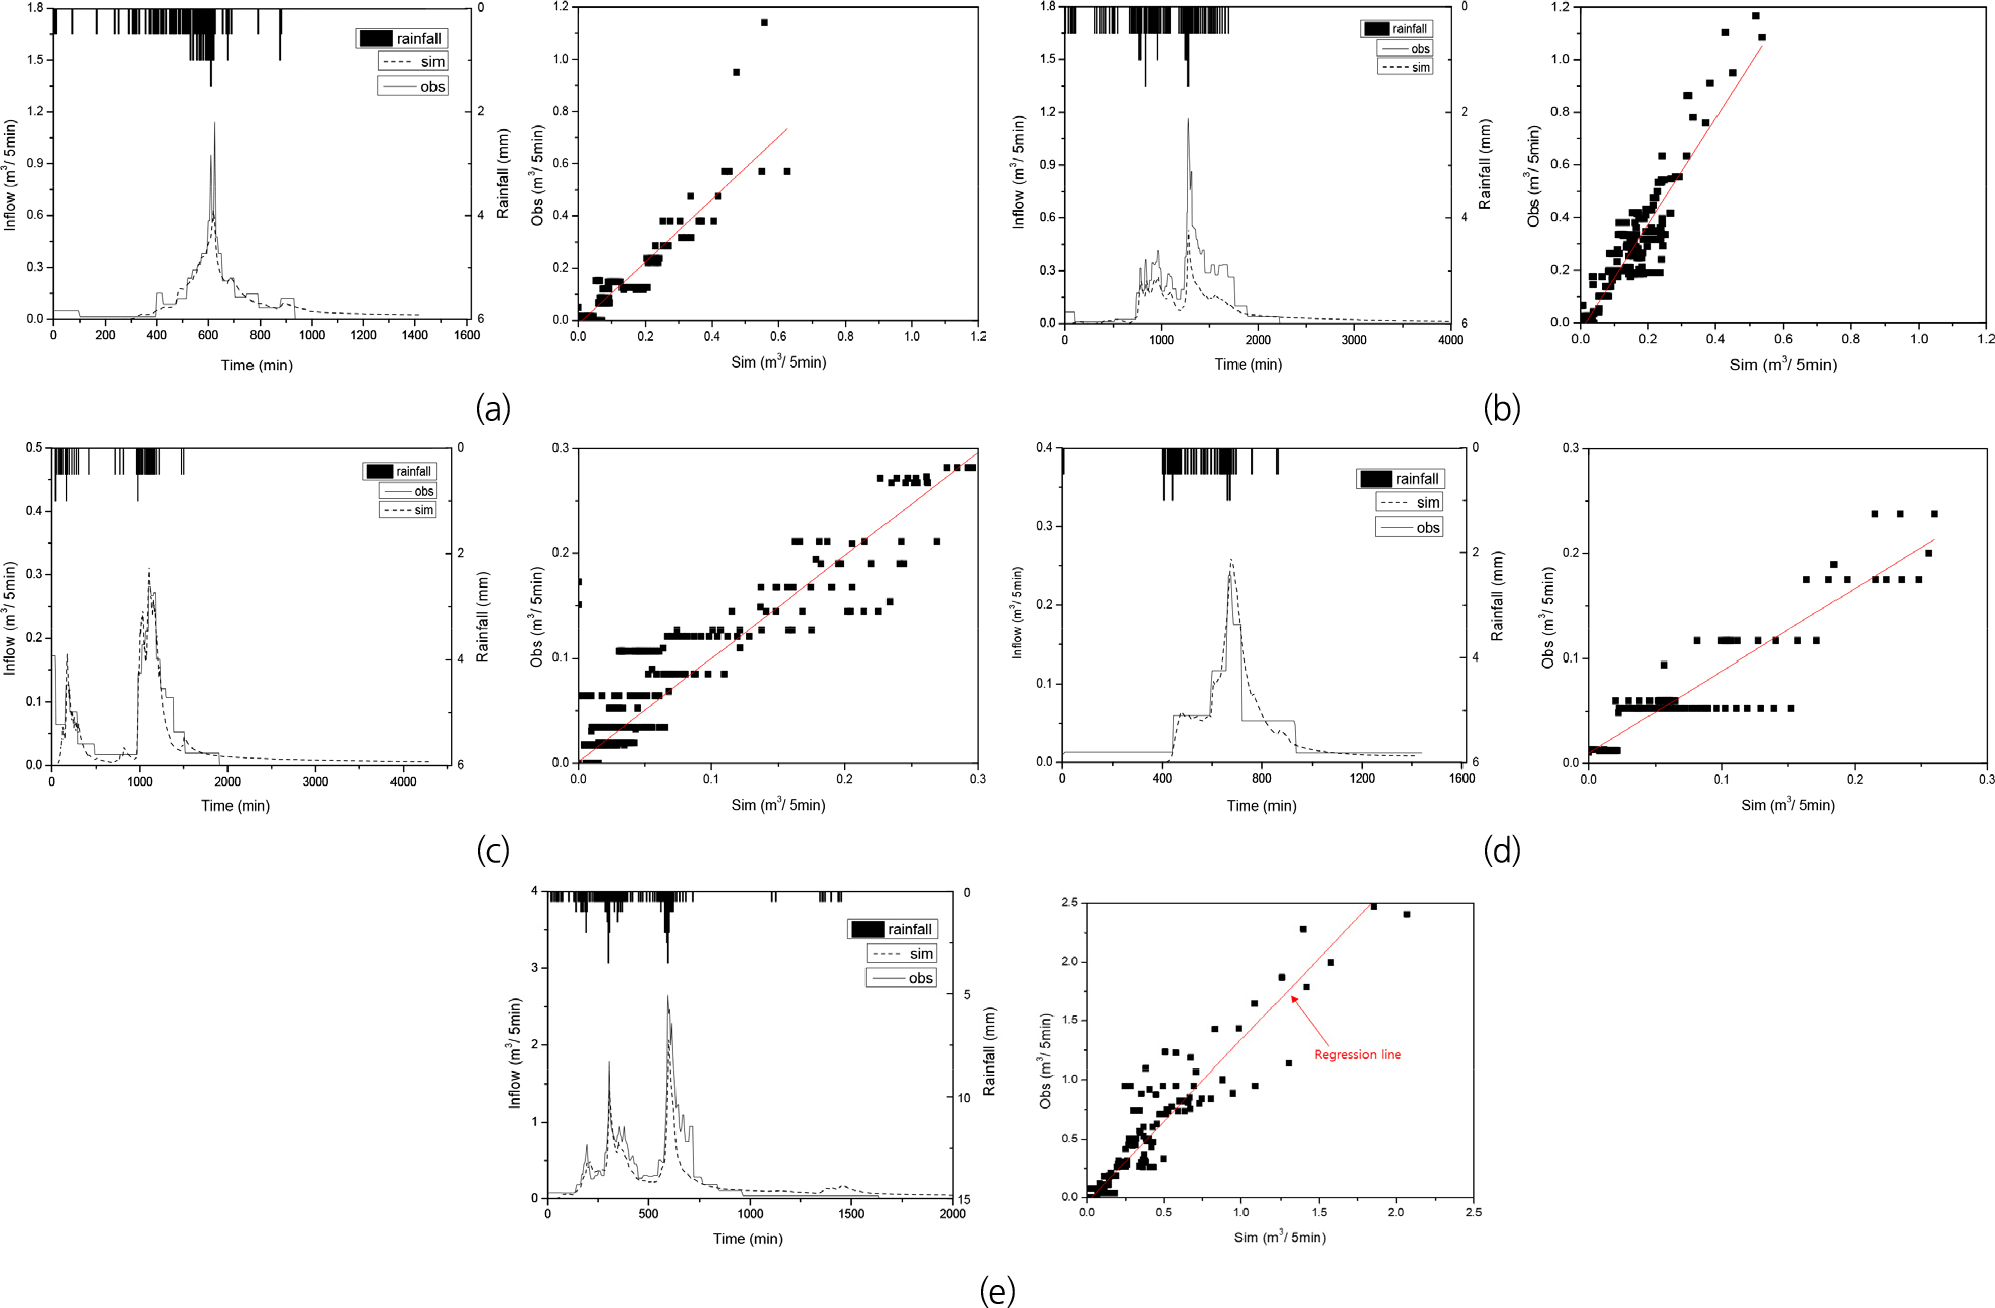
We conducted the calibration and verification of the model using rainfall data from the monitoring system in the Korea GI & LID Center. This was done by using the data of five rainfall events for rainfall analysis. These rainfall events occurred on 01/10/2017, 23/04/2018, 06/05/2018, 10/06/2018, and 28/06/2018. The rainfall data were entered at 5-min intervals, and the simulated results were used to calculate the flow rate in 5-min intervals. The observed values and the simulated values were compared, and the values of coefficient of determination (R2) and Nash-Sutcliffe efficiency (NSE) were calculated (Brown et al., 2013). Table 9 shows the evaluation values of the model, and the comparison between the observed values and the simulated values. Fig. 11 shows the graphs of the observed and simulated values.
Table 9.
Calibration and verification results
The water cycle efficiency of the bioretention LID facility was analyzed for various scenarios using the K-LIDM model. Three scenarios were selected: impervious watersheds with no LID, LID watersheds with no bioretention, and LID watersheds with bioretention. Fig. 12 and Table 10 describe the scenarios. The water cycle efficiency of the bioretention LID system was analyzed for short- and long-term rainfall. In case of short-term analysis, probability of rainfall (duration-frequency) from the Busan rainfall observatory was considered. The durations of the rainfall scenarios were 60, 120, and 180 min, and frequencies 2, 10, 20, and 30 years. The rainfall data were entered at 5-min intervals using the Huff method (third quartile storm). For the long-term analysis, rainfall and evaporation data collected at the Busan rainfall observatory of the past 10 years (2005-2014) were considered.

Table 10.
Description of the three scenarios
The outflow reduction effect of the bioretention LID facility was analyzed for short-term rainfall. Rainfall scenarios were classified according to duration-frequency using the probability of rainfall. The reduction effect of peak outflow in scenarios 2 and 3 was analyzed for comparison with scenario 1. For rainfall across 2 years, scenario 2 had a reduction effect of 89.50%, and scenario 3 had 100%. In particular, when the bioretention unit was installed, all inflow was stored and outflow did not occur. For rainfall across 10 years, scenario 2 had a reduction effect of 89.05%, and scenario 3 had 99.98%. A small outflow occurred at a duration of 180 min, and no outflow occurred at 60 min and 120 min. For rainfall across 20 years, scenario 2 had a reduction effect of 88.66%, and scenario 3 had 99.21%. As with the previous case, when the duration was 180 min, a small amount of outflow occurred. For 30-year rainfall, scenario 2 had a reduction effect of 88.47%, and scenario 3 had 98.50%. In this case, outflow occurred at 120 min and 180 min.
Table 11 shows the simulated values (peak outflow) for each scenario considered for short-term rainfall. The average outflow reduction was 88.92% in LID watersheds, and 99.42% in watersheds with both LID and bioretention. It can be seen that almost all the outflow was stored. Here, we see that the LID facilities have a significant impact on flood mitigation in extreme rainfall. Furthermore, a bioretention unit can maximize peak outflow reduction and peak time delay. Fig. 13 shows the hydrographs for each scenario.
Table 11.
Peak outflow (10-3 m3/s) for the three scenarios with respect to rainfall probability

The outflow reduction effect of the bioretention LID facility was analyzed for long-term rainfall. To simulate long-term outflow, 10-year rainfall and evaporation data were considered. Monthly and seasonal outflow characteristics of the 10-year average were analyzed using the simulation results. The flow duration was analyzed to examine the reduction of the outflow rate per day. Monthly runoff characteristics of scenarios 1, 2, and 3 were compared to analyze the outflow reduction. For scenario 2, the outflow reduction rate was 77.33~80.01% from January to December, and its average was 78.61%. For scenario 3, the outflow reduction rate was 85.16~96.93% from January to December, and its average was 91.09%. When scenario 2 and scenario 3 were compared, an outflow reduction of 34.55~84.75% was observed; the average value was 58.85%. Table 12 and Fig. 14 show the 10-year average monthly outflow.
Table 12.
10-year average monthly outflow (10-3 m3/s) for the three scenarios
| Month | Predeveloped | Non Bioretention | Bioretention |
| Jan. | 12.966 | 2.606 | 0.398 |
| Feb. | 34.214 | 7.238 | 2.507 |
| Mar. | 35.930 | 7.595 | 3.065 |
| Apr. | 27.326 | 5.705 | 2.061 |
| May | 43.087 | 9.222 | 4.372 |
| Jun. | 71.700 | 15.942 | 8.674 |
Next, the seasonal outflow characteristics of scenarios 1, 2, and 3 were compared to analyze the outflow reduction (Fig. 14 and Table 13). The outflow reduction rate in the spring was 78.82% for scenario 2, and 91.01% for scenario 3. The outflow reduction in the summer was 77.61% for scenario 2 and 86.91% for scenario 3. The reduction of outflow in the fall was 78.66% for scenario 2, and 91.77% for scenario 3. In the winter, outflows reductions of 78.90% and 92.83% were observed for scenarios 1 and 2, respectively. The outflow reduction during the winter was the highest, and that of the summer was the lowest. The reason for the high outflow reduction rate in the winter is that the outflow is low due to little rainfall. One would expect that the outflow reduction rate in the summer would be low because of greater rainfall and a correspondingly high outflow. It can be seen as a result of reflected the characteristics of rainfall in Korea, where rainfall is concentrated in summer.

Table 13.
10-year average seasonal outflow (10-3 m3/s) for the three scenarios
| Season | Predeveloped | Non Bioretention | Bioretention |
| Spring | 106.343 | 22.522 | 9.498 |
| Summer | 271.407 | 60.766 | 35.521 |
| Fall | 98.549 | 21.032 | 8.112 |
| Winter | 21.715 | 4.581 | 1.557 |
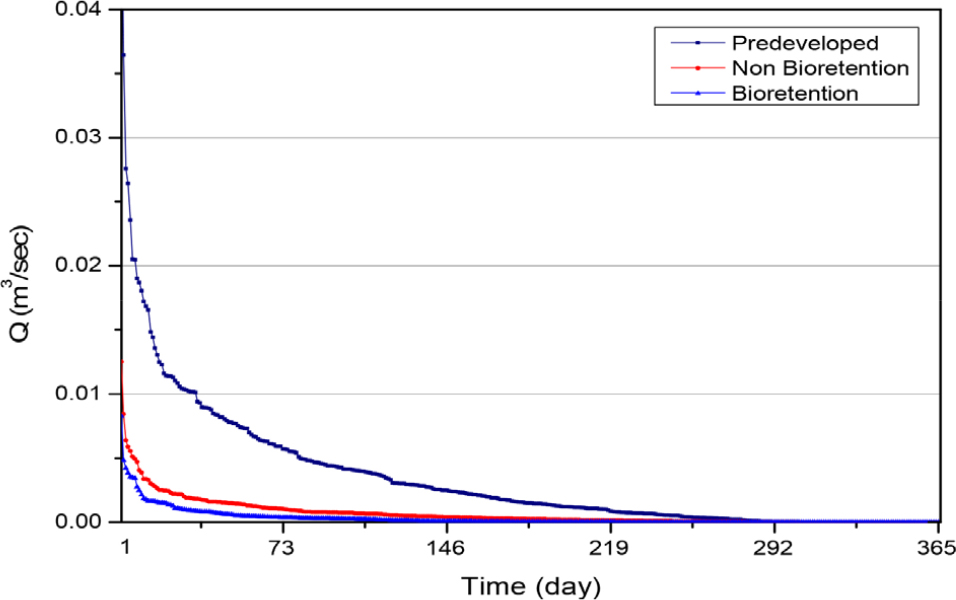
The flow duration in the bioretention LID facility was analyzed using 10-year rainfall and evaporation data from 2005 to 2014. The analysis of the flow duration was used to assess the flow rate variability of streams through annual flow observations. A flow duration curve shows the descending order of daily flow through a year. The relationship between the flow rate and duration encapsulates the variability of the flow rate in the stream. The coefficient of a river is calculated using the ratio of the maximum flow rate to the minimum flow rate. It is an important index for river planning.
In this study, we analyzed the daily average outflow reduction for a 10-year period, through the assessment of flow duration in the bioretention LID facility. Overall, compared to scenario 1, scenario 2 presented an outflow reduction of 80.74%, and scenario 3 indicated an outflow reduction of 91.27%. In Q1(flood flow), scenarios 2 and 3 showed outflow reductions of 75.60% and 83.85%, respectively. In Q2(three-month flow), scenario 2 had an outflow reduction of 82.59%, and scenario 3 had a reduction of 93.50%. In Q3(six-month flow), the outflow reduction was 84.10% for scenario 2 and 97.97% for scenario 3. Q4(nine-month flow) showed outflow reductions of 81.09% and 99.16%, and Q5(drought flow) presented outflow reductions of 74.26% and 100%. Table 14 and Fig. 15 show the outflows obtained through analysis of flow duration.
Table 14.
Outflow (10-3 m3/s) through analysis of flow duration
4. Discussion
Urban water disasters are continuously increasing in intensity and frequency due to the distortion of the water cycle system. Water management in urban watersheds requires a new paradigm to move in a more effective direction. LID technology is attracting attention as a distributed water management method for natural water cycle recovery. In this study, the water cycle efficiency of bioretention, one of the element technologies of LID, was analyzed. The bioretention facility located in the Korea GI & LID Center was used. We analyzed its characteristics and conducted hydrological analysis through real rainfall events. A bioretention model was constructed using the K-LIDM and its water cycle efficiency was analyzed for short- and long-term rainfall. The conclusions of this study are as follows.
Hydrological analysis of watersheds is essential to analyze the water cycle efficiency of bioretention LID facilities. To calculate the hydrological factors, the characteristics of watersheds and bioretention facilities must be identified. Prior to the estimation of storage capacity, zero adjustment of the monitoring system, ruler installation, and calculation of initial storage were conducted.
Experimental results show that overflow occurred at a water level of 0.95 m, and the amount of storage was 136.61 m3. The total storage of the bioretention unit was approximately 143.21 m3, with an initial storage of 6.6 m3. Using these results, the water level-storage curve was determined, and the H-S relational equation was deduced. The equation is S=135.51h2+10.486h+8.87, and the storage of the water can be immediately known.
Hydrological analysis of the bioretention LID facility was conducted in the Korea GI & LID Center monitoring system, using rainfall and water level data. Using the water level data, the storage change, inflow, and accumulative inflow were calculated, and the infiltration rate of the ground according to the hydrological soil group was applied. Based on the soil groups (A, B, C and D), the maximum storage and CN were calculated, and these values indicate quantitative reduction by soil infiltration. This would help adjust the performance of the infiltration or retention to suit design objectives. The rainfall-storage curve was deduced, and the relation equation, through analysis of 18 rainfall events, was also obtained. The equation was found to be , and the storage of the bioretention unit can be predicted according to rainfall information.
A model was constructed using K-LIDM to analyze the outflow and water cycle of the bioretention watersheds in the Korea GI & LID Center. The model was calibrated and verified using observations and simulated values for real rainfall events. R2 and NSE values were used in the evaluation of the model. The values of R2 and NSE were 0.808~0.895 and 0.633~0.828, respectively. The outflow reduction efficiency was analyzed for various scenarios for short- and long- term rainfall using the constructed model. We found that the LID facility installed on the impervious watershed had an outflow reduction effect of about 70% or greater, and the installation of the bioretention LID facility resulted in an outflow reduction effect of about 90% or greater. We note that the bioretention LID facility evidently maximizes outflow reduction.
In this study, we quantitatively analyzed the water cycle efficiency of the bioretention LID facility at the Korea GI & LID Center. Hydrological analysis of the watersheds was conducted using real rainfall events, and the rainfall-storage relationship was estimated. In total, 18 rainfall events were analyzed, but events with less than 30 mm of rainfall accounted for more than half. Therefore, the analysis of high rainfall events is insufficient, and if a greater amount of data for high rainfall events is analyzed, a more precise P-S relationship can be established. By reflecting events with rainfall of more than 30 mm or extreme events in future research, a quantitative performance analysis of bioretention LID that can respond to urbanization and climate change can be performed. Using K-LIDM, the outflow reduction effect of bioretention was analyzed for different scenarios. The runoff reduction performance of bioretention Lid was clearly superior to that of other LID elements. It will be possible to precisely analyze the water cycle efficiency of the bioretention LID facility by considering additional scenarios such as an increase in bioretention capacity or the arrangements within the bioretention facility. This allows us to know the extent to which bioretention LID contributes to the recovery of the water cycle within a specific watershed, and can be used as data to learn about the benefits that arise from reflecting bioretention LID in new cities or developed cities to be built in the future.
