1. Introduction
2. Materials and Methods
2.1 Study area
2.2 Data preparation
2.3 Principal component analysis
2.4 Correlation analysis
3. Result and Discussion
3.1 Water quality changes in the Geum River
3.2 Correlation analysis in the Geum River
3.3 Spatial variation of water quality in the Geum River and its tributaries
3.4 Pollutant source identification of the tributaries
3.5 Correlation analysis for the two basins
4. Conclusions
1. Introduction
Surface water pollution with physical, biological, and chemical contaminants through anthropogenic activities are becoming a great concern worldwide (Noori et al., 2010; Ouyang et al., 2006). Especially tributaries or channels in a watershed play an essential role in carrying out pollutants from urban land, agricultural land, forest land, and municipal wastewater (Singh et al., 2005; Wang et al., 2007). An excess concentration of nutrients, specifically nitrogen and phosphorus, can lead to eutrophication and algal bloom. It causes depletion of oxygen, fish kills, biodiversity loss, impairs water use for drinking, and disturbs the environment with unpleasant odors (Voutsa et al., 2001). Assessment of river water quality and identification of major pollutant sources is of great significance as it has a direct influence on the aquatic ecosystem. In general, water quality assessment and management tend to focus inside water bodies. However, it cannot be overemphasized that pollutant loads coming from their tributaries are a major factor of water quality changes in the main river.
However, identification and management of pollutant sources for the deterioration of the water quality of a river is challenging. Especially when there is a large set of water quality data, the prospect of difficulties for interpretation is evident. To achieve this goal, a multivariate statistical method such as principal component analysis (PCA) can be utilized. PCA is a multivariate statistical technique that is very efficient for identifying important pollutant factors. PCA has been applied to a variety of environmental applications, including groundwater, surface waters, lake sediments, wastewater, and soils (Bzdusek et al., 2006; Gangopadhyay et al., 2001; Gupta et al., 2018; Soonthornnonda and Christensen, 2008; Vaccaro et al., 2007; Vega et al., 1998). (Zeinalzadeh and Rezaei, 2017) have applied PCA to investigate the environmental effects of discharge from different activities in Shahr Chai River, Iran, and identified the impact of agricultural, rural, and animal breeding activities on the water quality change in the river. (Marinović Ruždjak and Ruždjak, 2015) have selected 18 water quality variables for PCA and identified seven principal components as a major factors. The factors are identified as organic pollutants related to human activities, chemical inputs, agricultural chemical application, municipal & industrial sewage and so on. Therefore, PCA seems to be an effective method in identifying pollutant source for a water body with a large set of data.
In the Geum River, a higher algal bloom is recorded, especially downstream of the river. Previous studies also analyzed the occurrence of algae bloom in the downstream of the river (Seo et al., 2020). Hence, identifying the major pollutant sources responsible for the water quality deterioration and algal bloom is a priority for the Geum River. Therefore, the main objective of this study is to identify the significant pollutant sources from the two highly polluted tributaries of the river and specifically to distinguish the limiting nutrients for algal growth. This identification will help for management strategies of the pollutant sources and reduction of the limiting nutrients from the sources. Insight from the present study could provide scientific guidance for the control and management of pollutant discharge into the Geum River.
2. Materials and Methods
2.1 Study area
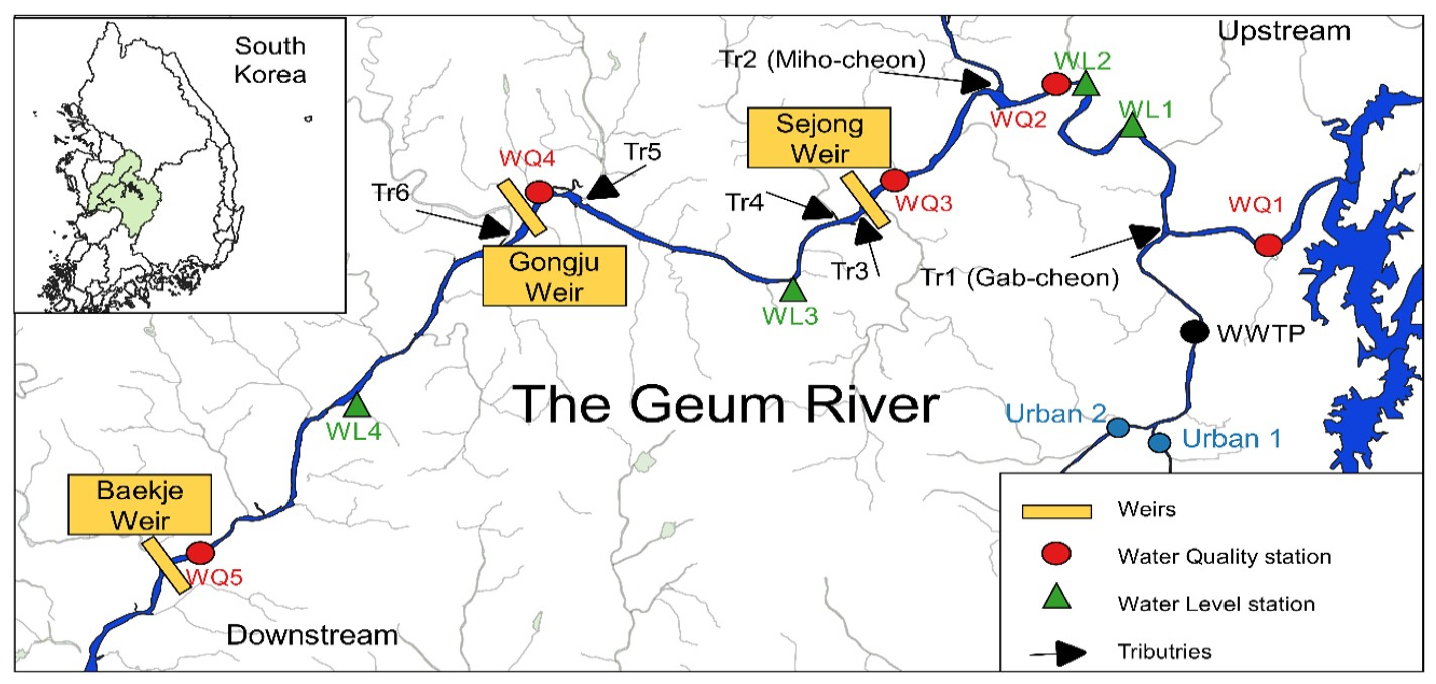
The Geum River is the third largest river in South Korea, with a watershed area of 9859 km2 and a total length of 395 km. It flows northward through the watershed and eventually flows to the west side of the ocean of Korea via the Geum River estuary dam. The river is used for municipal, industrial and agricultural purposes in the vicinity areas. The study area covers the lower Geum River section from Daecheong balancing reservoir dam (WQ1) up to Baekje weir (WQ5), with a total length of 69.5 Km. There are six major tributaries (Tr1 through Tr6) along the study section, as shown in Fig. 1. In the study area, there are three weirs (Sejong, Gongju, and Baekje weir) constructed in the Geum River. These weirs have two different gate operating systems. Phase-1 was where the weir gate operation was fully closed, and the phase-2 was where the weir gate operation was fully opened.
2.2 Data preparation
The Geum River water quality was analyzed at five water quality monitoring stations, as shown in Fig. 1, with daily data for 8- years (2013-2020). The water quality variables and flow rates data were obtained from the Korean national database system (water.nier.go.kr, wamis.go.kr). In this study, 14 water quality variables are used. These variables are water temperature, dissolved oxygen (DO), biochemical oxygen demand (BOD), chemical oxygen demand (COD), total suspended solids (TSS), total organic carbon (TOC), pH, electrical conductivity (EC), ammonia nitrogen (NH4), nitrate nitrogen (NO3), total nitrogen (TN), total phosphorus (TP), chlorophyll a (Chl-a) and flow. The data were standardized for PCA and correlation analysis to the same scale with a mean of zero and standard deviation of one.
2.3 Principal component analysis
Principal component analysis (PCA) is the most popular and well-established multivariate statistical technique and is used in different disciplines. The main objective of principal component analysis in environmental science is to interpret and identify pollutant sources by reducing the dimensionality of a large set of data to low dimensions by a linear transformation without losing relevant information (Helena et al., 2000; Larose, 2006; Parsons, 2004). It is used to evaluate, interpret, and find new variables and explain most of the total variation with important principal components (Dabrowski and De Klerk, 2013). The principal component can be expressed as:
Where x1, x2 are original variables and a11, a12 are eigenvectors.
In PCA, eigenvalues and eigenvectors are extracted from the covariance matrix of the original variables. An eigenvalue of a matrix A is a scalar () if there is a non-zero vector x satisfies that Ax = x. For matrix A, the eigenvalue can be calculated from the characteristic’s equation, det (A-I) = 0, where det is the determinant, and I is an identity matrix. An eigenvalue of greater than 1 is used to extract the principal components according to Kaiser rule. Any principal component with an eigenvalue of less than 1 has less significance and accounts for less data variability. Based on the eigenvalues, principal components can be extracted with important information according to the Kaiser rule (Kaiser, 1960).
2.4 Correlation analysis
Correlation analysis measures the strength and direction of a linear relationship between variables. It evaluates whether there is statistical evidence for a linear relationship between variables in the population. A value between -1 and 1 is assigned to check the association between variables, where a value close to -1 shows a negative correlation, a value close to 1 shows a positive correlation, and 0 indicates no correlation.
3. Result and Discussion
3.1 Water quality changes in the Geum River
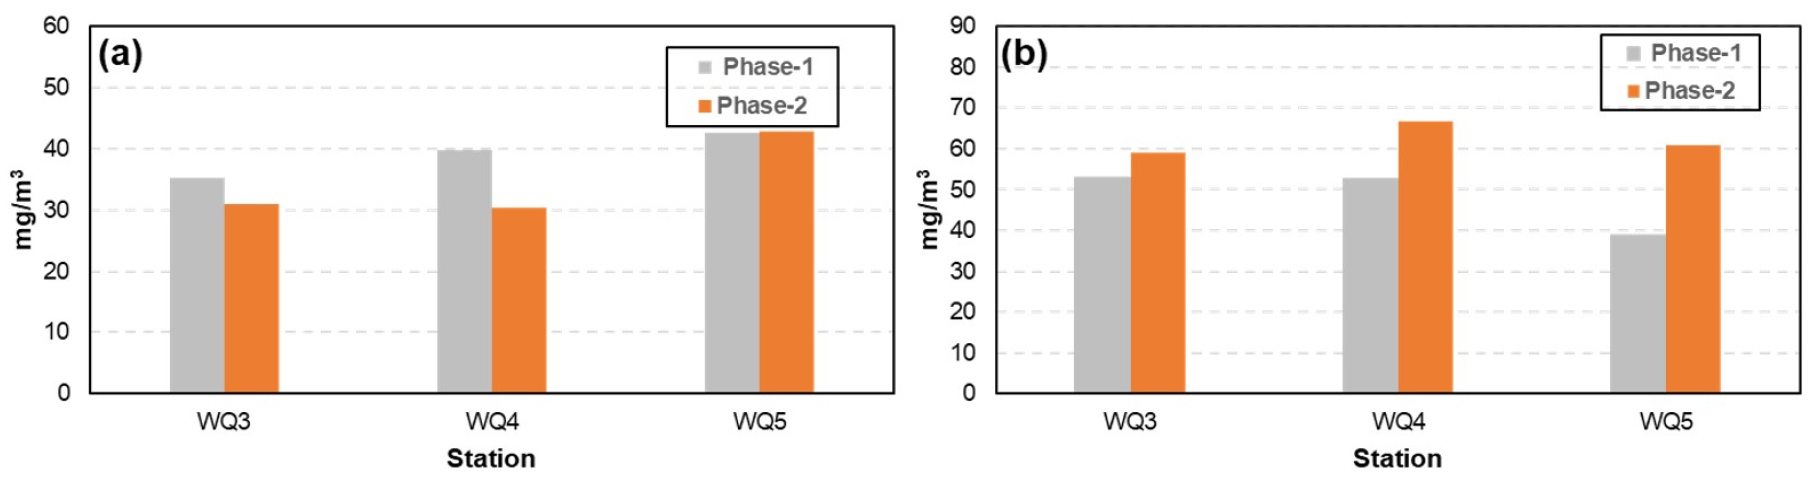
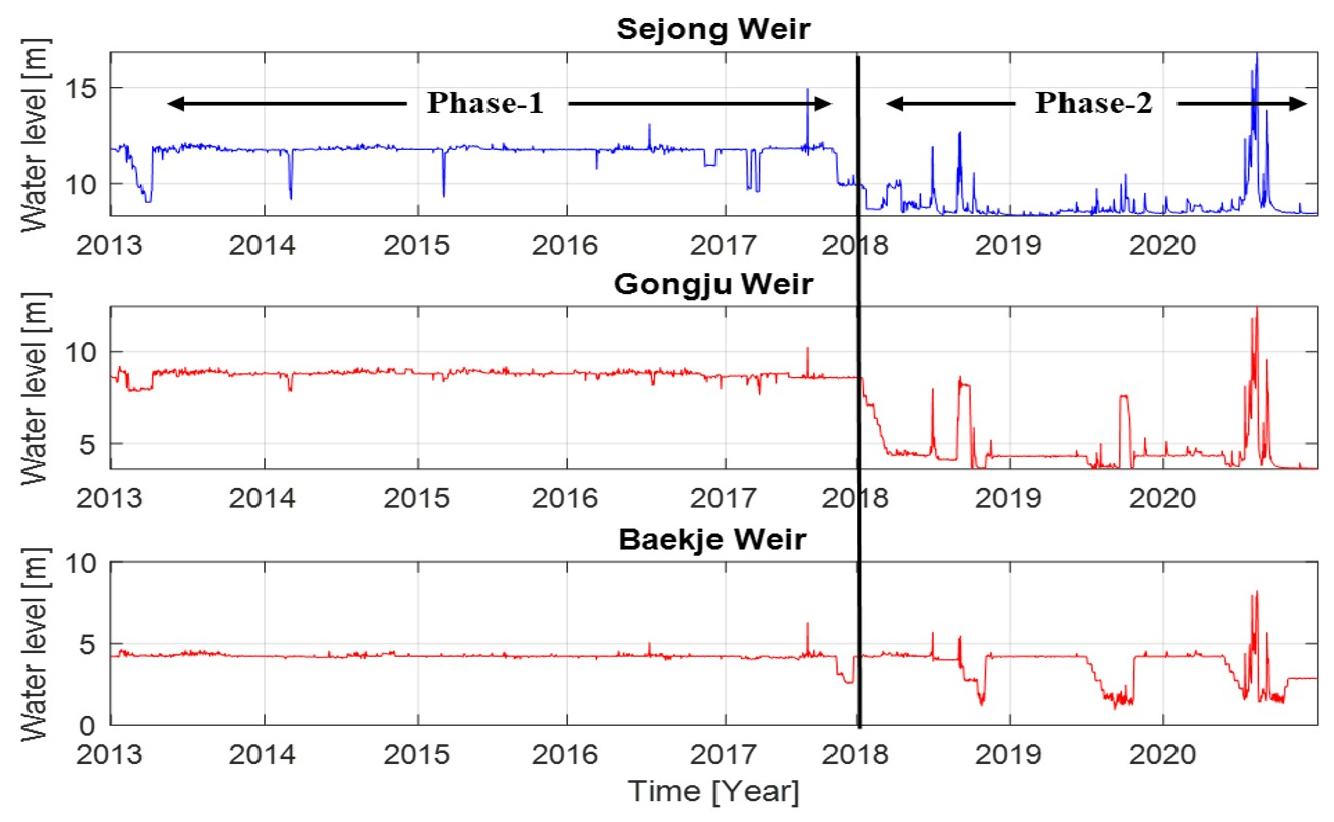
The variation in the water quality of a river depends on the watershed characteristics, pollutant load from its tributaries, and structures built on the river, such as weirs and dams. The Korean government constructed 16 in-stream weirs in four major rivers for drought and flood control (Seo et al., 2012). Among those, three weirs were constructed in the Geum River. In the Geum River, the weir gate operation system was divided into two phases. The phase-1 was from 2013 ~ 2018, when the weir gate was closed, and water only flows over the structure, whereas in phase-2, the weir gate was fully opened, and water can flow freely through the gate. The weir gate operation greatly influences the water quality, especially the algal growth in the downstream of the river. Fig. 2 shows the annual and summer average concentration of chl-a changes due to gate operations. In annual, the chl-a concentration has decreased at WQ3 and WQ4 by 12.4% and 24%, respectively, due to open gate operation. However, there are no significant changes were recorded at the WQ5 station. In summer open gate phase, the chl-a has shown an increasing trend in all the three monitoring stations, with the highest increase at WQ5 station. The open gate phase at WQ5 station has increased the chl-a concentration by 1.5 times than closed phase. This indicates that the warm and wet season, paired with an influx of nutrients, creates a favorable condition for algae to quickly proliferate. The volume of the water is also another factor for the change in the chl-a concentration. In phase-2, where the gate was fully open, the water level has decreased greatly in all weirs as shown in Fig. 3, which leads to a decrease in water volume of the river. As concentration is inversely proportional to the volume of water, the decrease in water volume in open gate phase will increase the concentration. In addition, the decreased residence time due to Phase-2 in upstream would allow less time for consumption of nutrients, which allow high nutrients to move in the downstream, leading to algal growth. Furthermore, the deposited sediments and nutrients during the closed gate phase might be transported when the gate is opened, where the velocity of the water is high. Bottom sediments can also act as a potential internal pollution source of nutrients for algal growth (Seo and Canale, 1999).
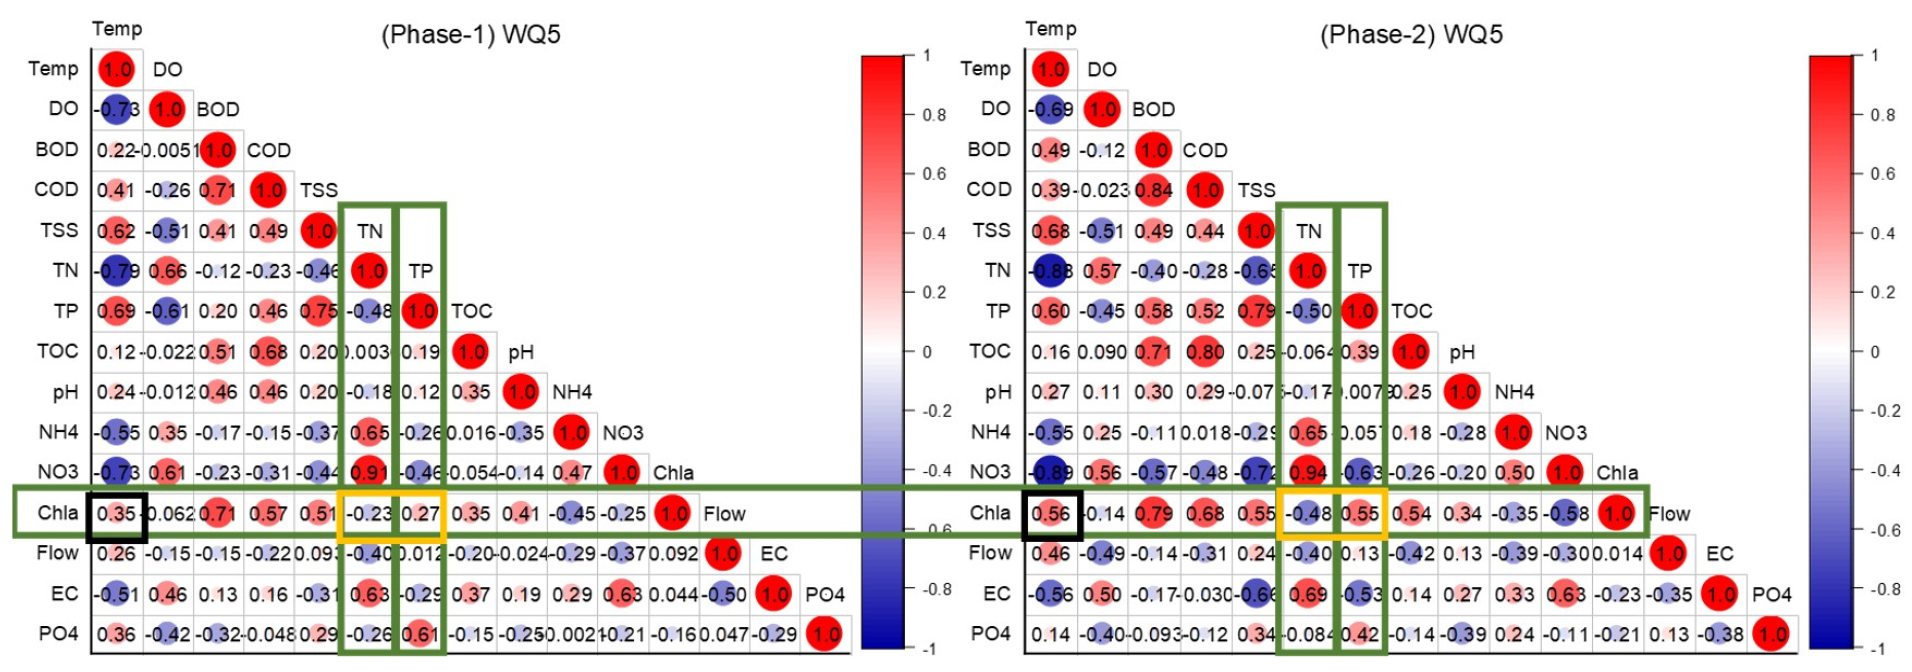
3.2 Correlation analysis in the Geum River
Correlation analyses were also analyzed to investigate the level of algal growth with respect to the water quality variables at three (WQ3~WQ5) water quality monitoring stations. At WQ3 station, TN has a negative correlation with Chl-a in both open and closed gate phase, indicating TN does not influence the growth of algae and TP does not show significant influence at this station. At WQ4 station, the influence of TP has increased promptly with a strong correlation of r = 0.45 at the closed phase and r = 0.47 in the open phase. On the contrary, in the closed phase of WQ5 station, the influence of TP on the algal growth was insignificant, but when the gate was open, its influence rose up with a correlation of r = 0.55. In this phase, the temperature also has a significant role in the algal growth as shown in Fig. 4. In open gate phase, Temp has a strong positive correlation with Chl-a with r = 0.56. on the other hand, PO4 does not correlate with Chl-a in both closed and open gate operation phases. In addition to correlation, we confirmed the limiting factor by using N: P rations as a tool to predict the nutrient limitation of algal growth in the Geum River. Nitrogen to phosphorus ratio (N/P) is often used to evaluate the limiting nutrient on the algal growth (Thomann and Mueller, 1987). If N/P ratio is greater than ten, it indicates phosphorus is a limiting factor for algal growth. In this study, the N/P ratio is greater than 10 indicating phosphorus is a limiting nutrient in the Geum River. Previous studies (Kim et al., 2021) also confirm that phosphorus is a limiting nutrient in the Geum River.
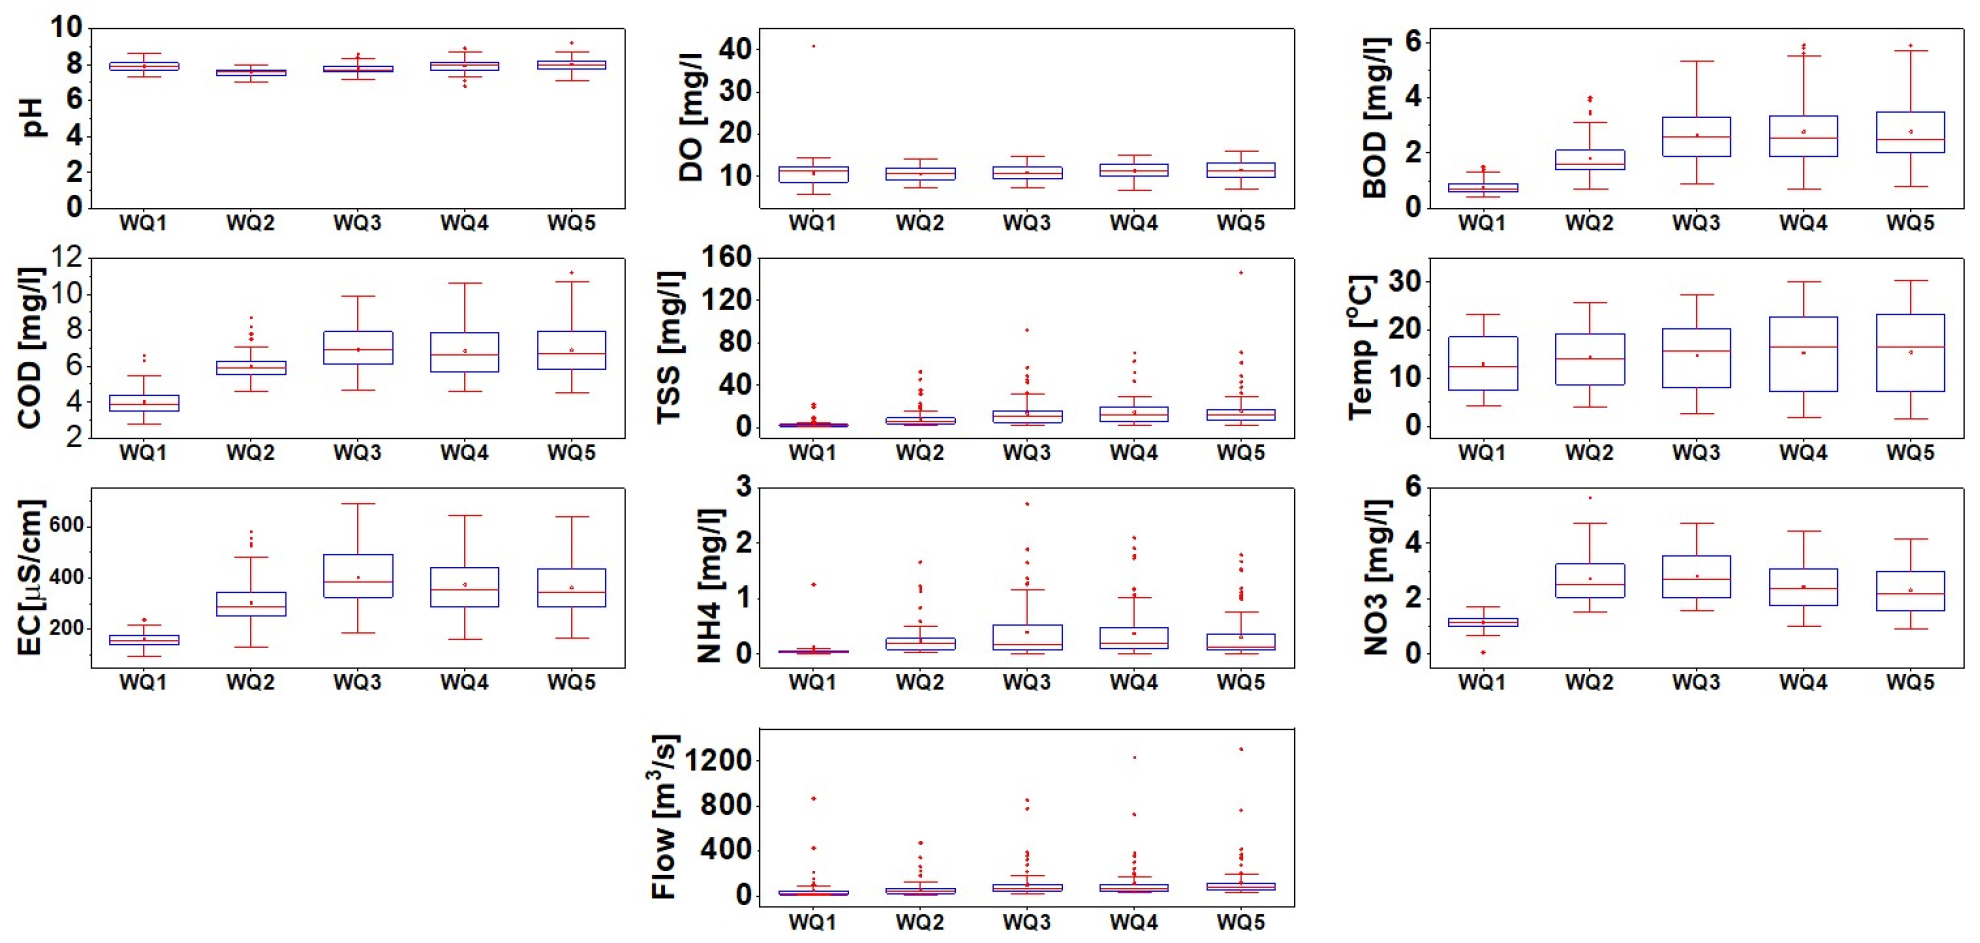
3.3 Spatial variation of water quality in the Geum River and its tributaries
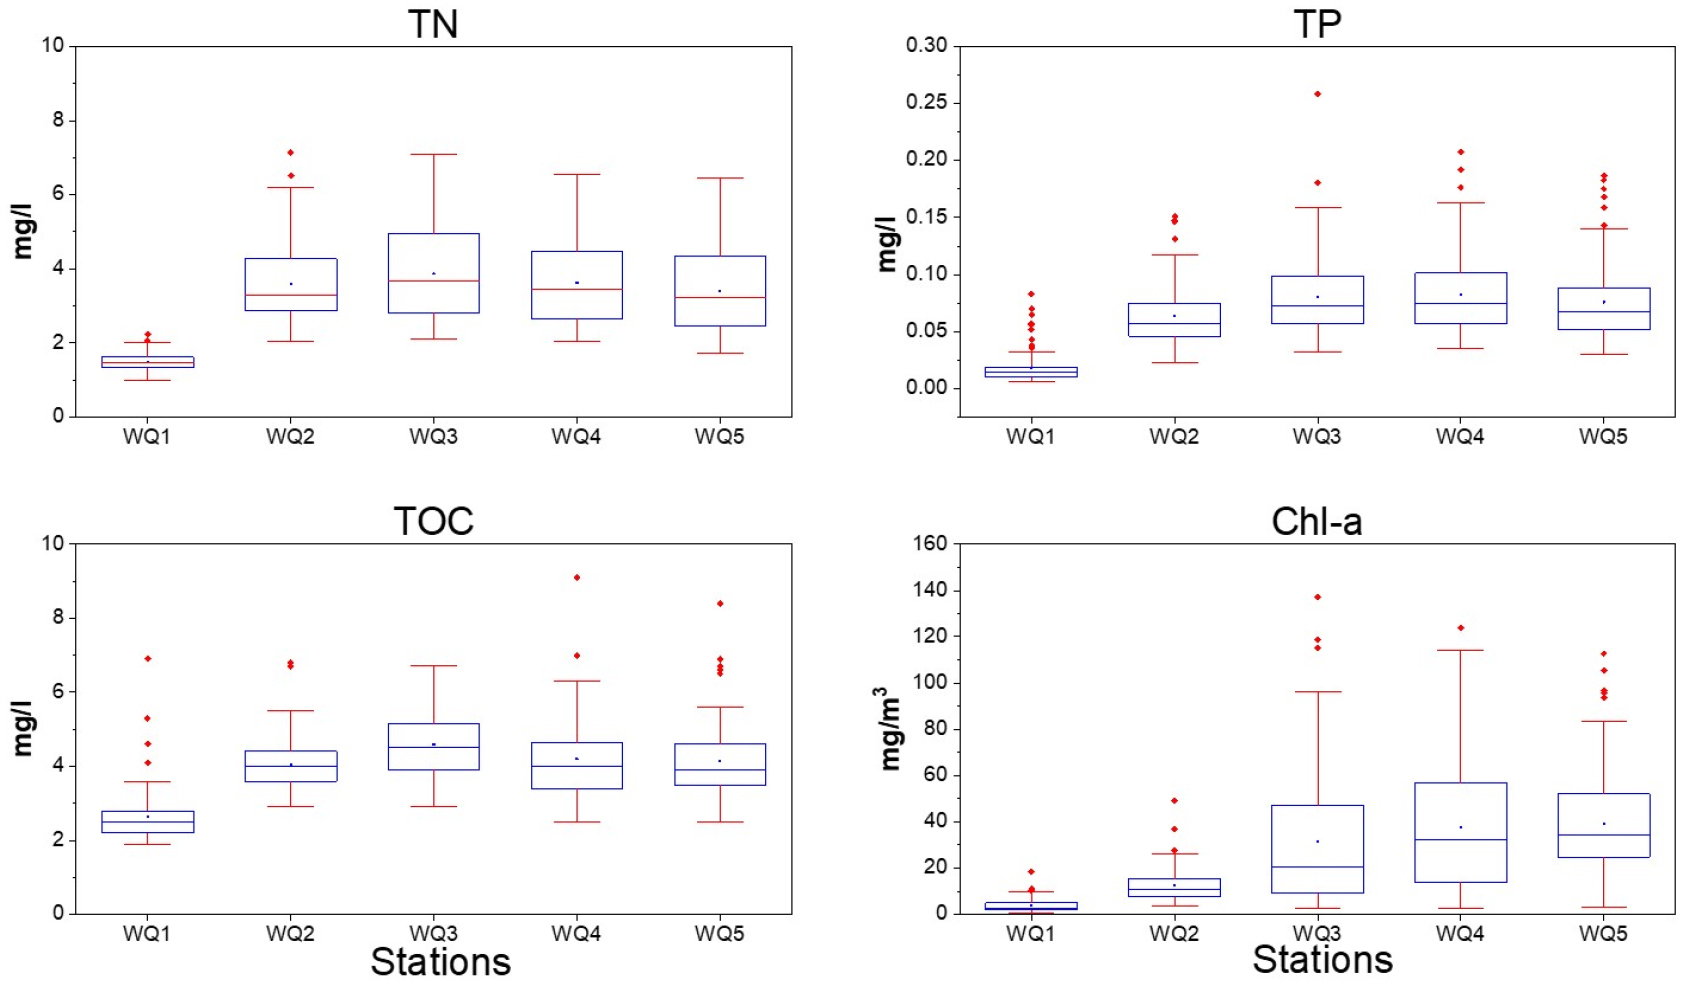
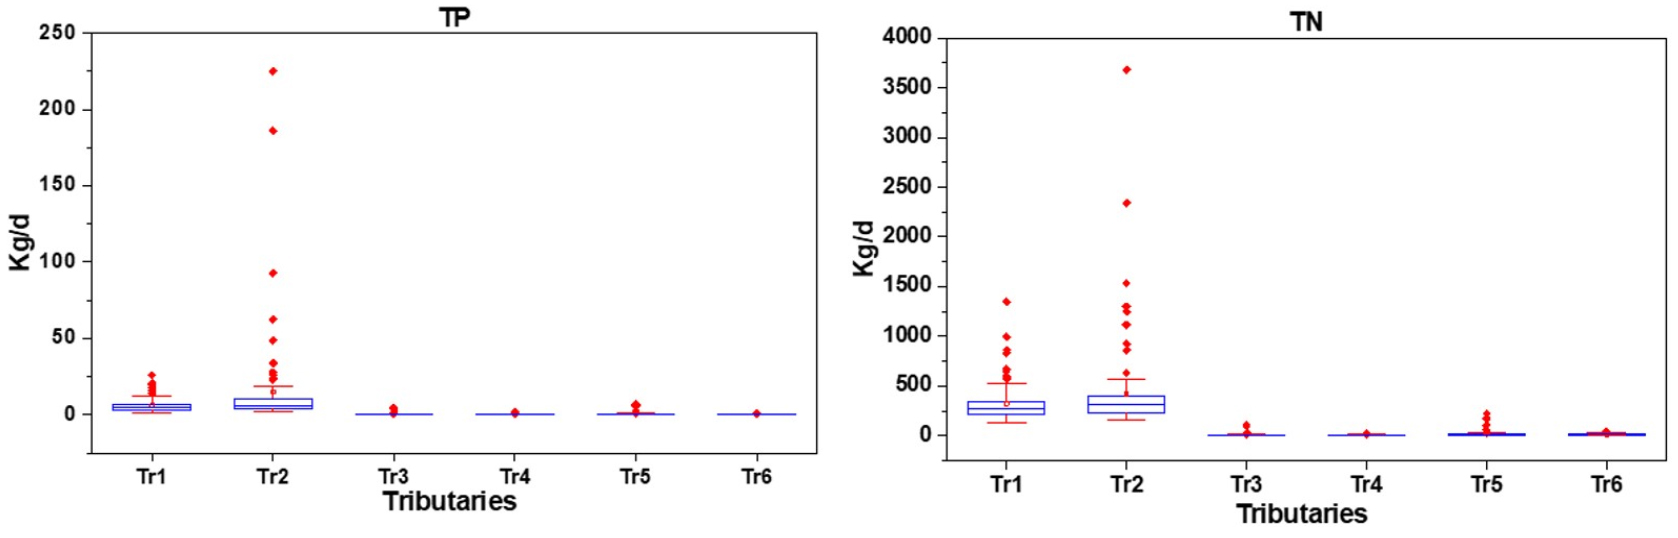
A Box plot is a type of chart used in explanatory data analysis. It provides a visual summary of the data distribution and skewness, displaying the data percentiles and averages. Fig. 5 shows the box plot of selected water quality variables for the five water quality monitoring stations in the study site from 2013∼2020, including both closed and open weir gate operation. The station WQ1 (Daecheong Dam) is the most upstream location and the headwater and thus shows the best water quality in general. However, after the first tributary, Gab-cheon, the nutrient concentration increased rapidly. The average concentration of TN, TP, TOC, and Chl-a has increased by 2.4, 3.4, 1.5, and 3.5 times at WQ2 compared to WQ1, respectively. This is due to the high pollutant load coming from Gab-cheon. At WQ3 station, no indication of improvement shown due to the pollutant load coming from the second tributary, Miho-cheon. At WQ3 station, TN, TP, TOC, and Chl-a concentration has increased by 2.6, 4.3, 1.7, and 8.5 times compared to WQ1. After WQ3, the concentration of TN and TOC started to decline due to the removal of pollutants by settling or biochemical reactions. However, TP and Chl-a, the concentration keeps increasing due to algal growth in the area. Fig. 6 shows the pollutant load of the tributaries, and Gab-cheon (Tr1) and Miho-cheon (Tr2) have the greatest pollutant loading among the tributaries, indicating that these two tributaries are the major tributaries affecting the water quality of the Geum River. The remaining water quality variables has also shown a higher concentration at WQ2 and WQ3 station (Appendix. 1).
3.4 Pollutant source identification of the tributaries
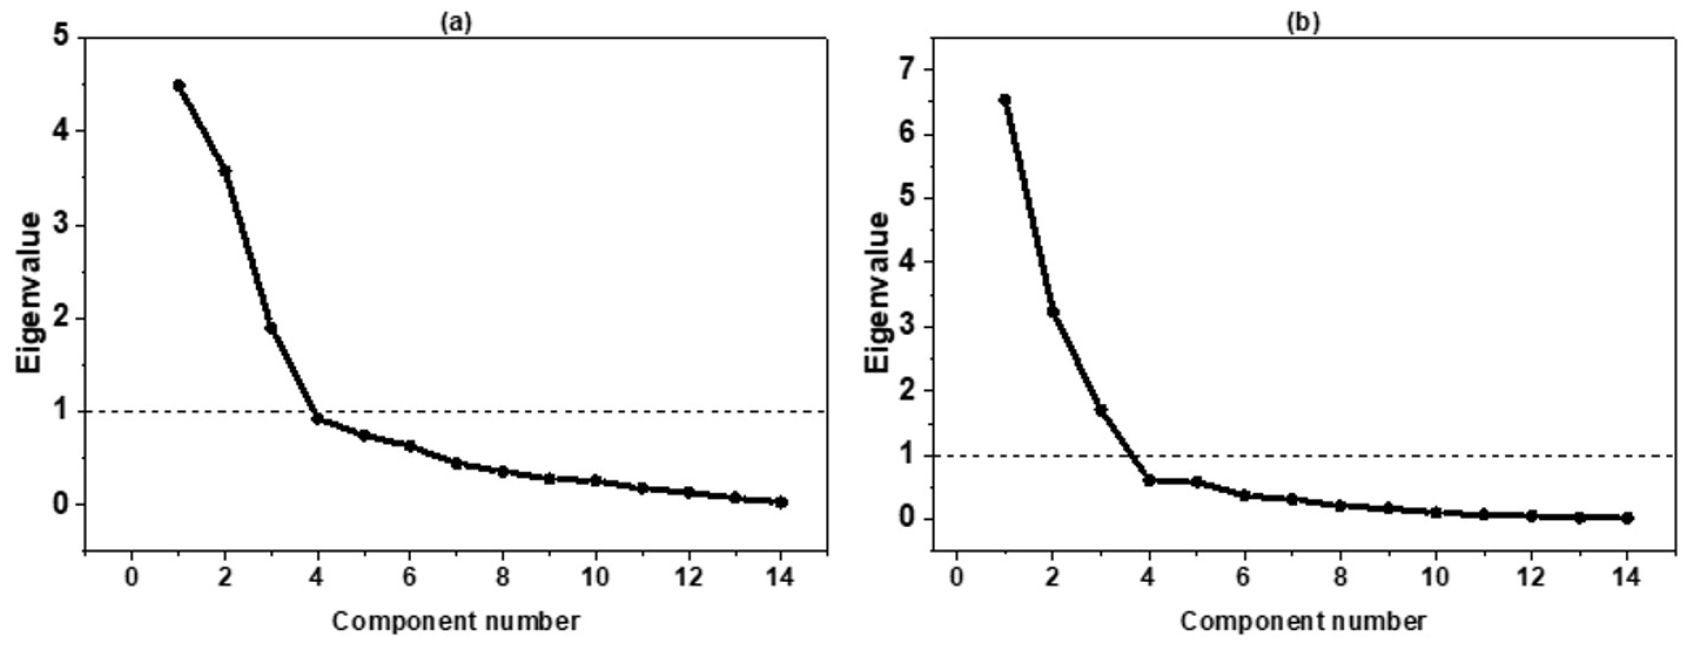
The PCA analysis was performed to understand the relationship between water quality variables and identify the major pollutant sources from the two major tributaries. For the analysis, a station downstream of the two tributaries where they met the Geum River was selected. An eigenvalue greater than one was used to retain the principal component (PC), and three components for both tributaries were extracted, as shown in Fig. 7.
3.4.1 Principal component analysis for Gab-cheon
PCA was conducted for the establishment of a combination of variables that can describe the principal tendencies of pollutant sources using covariance of the data matrix. The analysis is applied to the two major tributaries of the river, Gab-cheon and Miho-cheon for pollutant identification. For Gab-cheon, the principal component elucidated 71.2% of the total variance. PC1 explains 32% of the variance showing electrical conductivity (EC), nitrate-nitrogen (NO3), total nitrogen (TN), and dissolved oxygen (DO) with a positive loading and also Flow, total suspended solids (TSS), and temperature (Temp) with a negative loading, which indicates that these two groups have an inverse relationship as shown in Fig. 8. TN is not readily adsorbed in suspended solids; instead, dominant as a dissolved form, and it is independent of sediment transport (Seo and Kim, 2016). DO, which is an essential parameter in maintaining the equilibrium of the aquatic ecosystem, is inversely affected by Temp, reflecting DO is determined by its solubility (Badran, 2001). The loading in PC1 of Gab-cheon indicates that the winter season significantly influences water quality deterioration. The EC in this group shows that more chemicals and salts might dissolve in water from wastewater treatment plants. In addition, in the low flow season, the concentrations of nitrogen components are high from Daejeon WWTP effluent, as shown in Fig. 9.
The pollutant load from Daejeon WWTP and the urban area just before the WWTP discharge location were compared, as shown in Fig. 8. In WWTP discharge, a relatively higher concentration of TN and NO3 was found. It seems PC1 groups reflect discharges from WWTP. The increased TN concentration at WQ2 station might be the pollutant load coming from the WWTP.
On the other hand, PC2 of Gab-cheon explains 25.5% of the variance with positive loading of TSS, TOC, chemical oxygen demand (COD), biochemical oxygen demand (BOD), and TP (Fig. 8). In this group, all the variables have a positive correlation to each other. Pollutant indicators, BOD, COD, and TOC are correlated together as they indicate organic matter content in the river. Organic pollutants are originated from anthropogenic activities, especially from combined sewer overflows in the case of urban areas. This organic pollutant affects aquatic organisms by lowering oxygen. Consequently, the WQ2 station downstream of Gab-cheon, recorded a decrease in the availability of dissolved oxygen. At the same time, TP and TSS show a positive correlation due to the characteristic behavior of TP to be adsorbed in sediments (Kim et al., 2021). As TSS wash off to the rivers due to runoff, the concentration of TP also increases. In Korea, the summer monsoon is the primary driver of TP and suspended solids due to intense precipitation and runoff behavior (Jones et al., 2009; Lee et al., 2015). In Gab-cheon watershed, the urban area covers 18.2% of the land cover, as shown in Table 1. It seems organic pollutants, suspended solids, and TP mostly originated from urban area of Daejeon, with 1.5 million residents. The last component, PC3, explains 13.5% of variance containing Temp, Chl-a, and pH with a positive loading and ammonia (NH4) with negative loading. As Chl-a is a pigment for the photosynthesis of algae, the increase in light intensity and temp will accelerate the photosynthesis activity, which leads to an increase in algal growth (Chl-a). At the same time, algae thrive when a high pH is maintained in the water. Owing to this, the chl-a concentration started to accelerate in the downstream. Furthermore, the warmer the temperature, the greater the algal growth. In addition, pH and Temp have a positive correlation. Lime-containing fertilizers might induce the increased pH in the high flow season washed off from agricultural land. Therefore, this factor might represent pollutants from agricultural land. Therefore, it is estimated that PC1, PC2, and PC3 in Gab-cheon can be related to Daejeon WWTP, urban and agricultural sources, respectively.
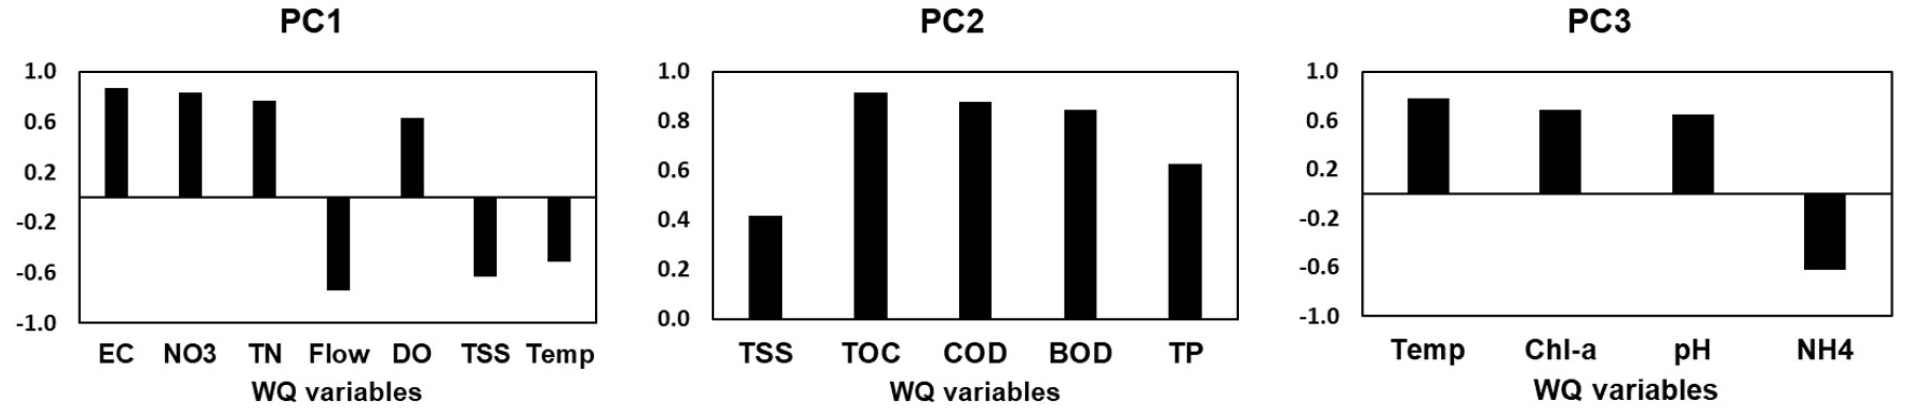
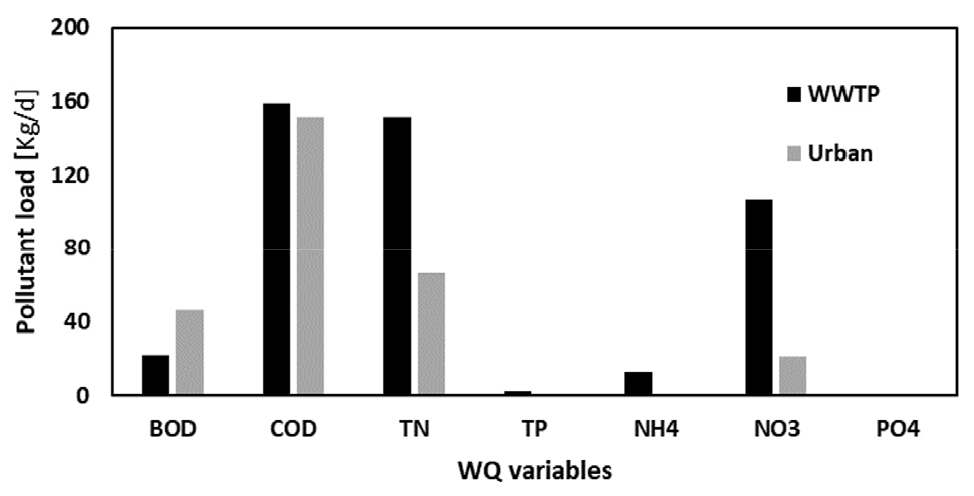
Table 1.
Land cover area distributions for Gab-cheon basin and Miho- cheon basin
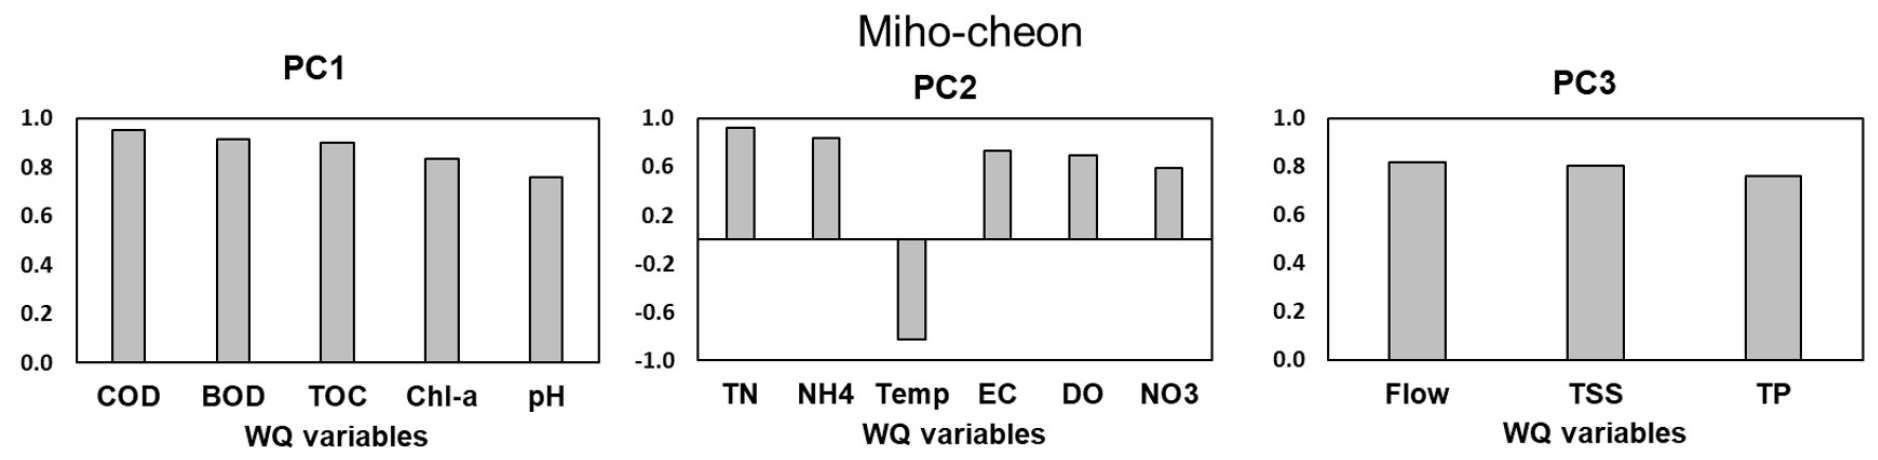
3.4.2 Principal component analysis for Miho-cheon
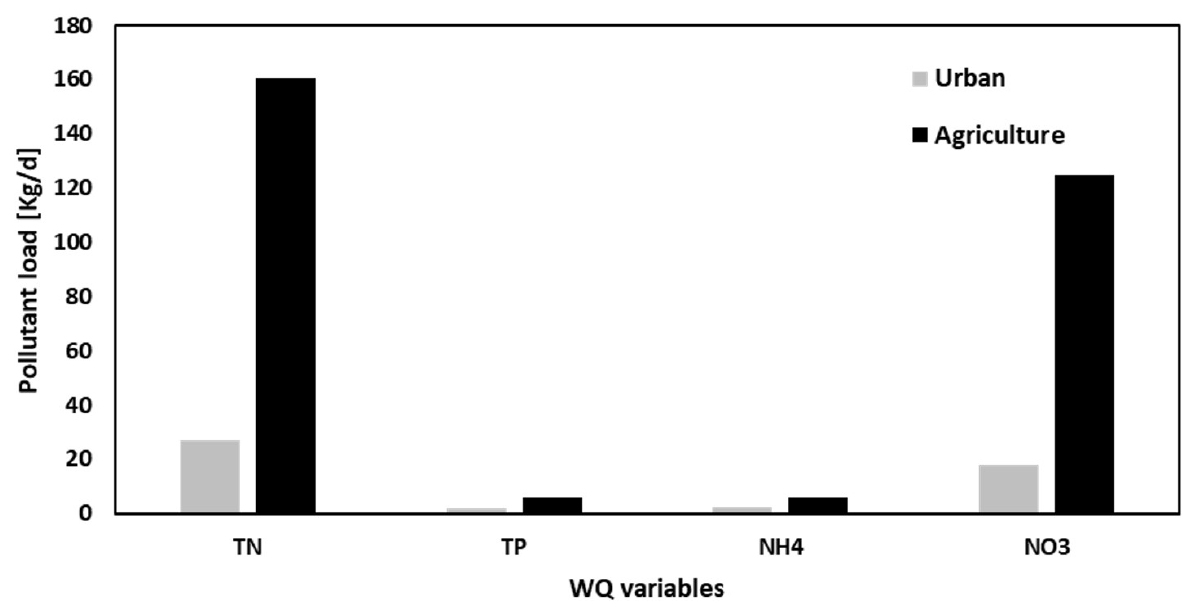
The PCA was performed in Miho-cheon to comprehend the underlying relationship between the water quality variables and identify their characteristics. For Miho-cheon, the principal component explains 81.9% of the total variance. COD, BOD, TOC, pH, and Chl-a are loaded in PC1, which explains 46.6% of the variance, as shown in Fig. 10. The organic pollutant indicators are grouped together. PC1 in Miho-cheon is similar to PC2 of Gab-cheon. In this factor, urban pollution coming from Cheongju city, where more than 0.8 million people lives, might be the source of pollution. Due to this, organic carbon concentration at WQ3 station shows the worst quality. In South Korea, 81.4% of the population lives in in urban areas, which makes organic pollutants rise, leading to severe surface water pollution. PC2 explains 23.1% of the variance with a positive loading of TN, NH4, NO3, EC, and DO and with a negative loading of Temp. The nitrogen components, EC and DO, has a positive correlation. Nitrogen-containing fertilizers and pesticides, which are widely used for agricultural practice in the nearby river, can be contributing to this pollution factor. These factors might contribute from agricultural pollution. In the Miho watershed, the agricultural area is the second largest land use group after the forest area. This pollution source is responsible for the increase of TN at WQ3. In addition, the pollutant load from the agricultural site is compared to urban land, as shown in Fig. 11. The result showed that a high pollutant load of nitrogen components is coming from the agricultural land. PC3 explains 12.1% of the variance with a positive loading of Flow, TSS, and TP. In this component, the summer monsoon significantly affects delivering suspended solids due to runoff (Jones et al., 2009). At the same time, the concentration of TP has increased due to its adsorption behavior to sediments in surface runoffs from agricultural, urban, and forest areas. Therefore, it is estimated that PC1, PC2, and PC3 in Miho-cheon can be related to agricultural, urban, and forest sources, respectively.
3.5 Correlation analysis for the two basins
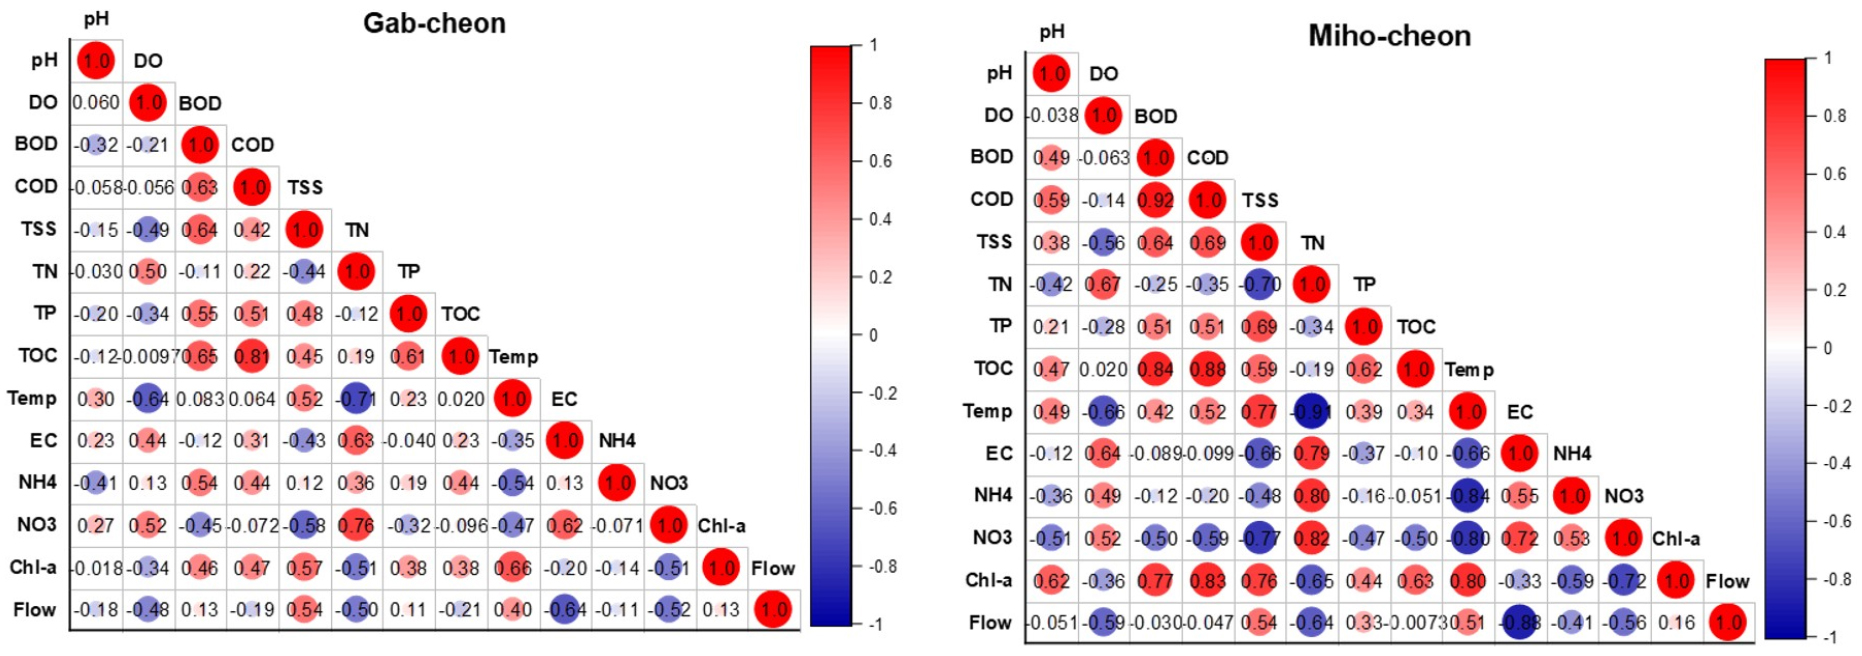
A correlation analysis is applied for the basins to point out the association between the variables and to check the coherence of the data with the PCA result. The correlation analysis result for both basins matches the PCA result, as shown in Fig. 12. For Gab-cheon, TN and EC (r = 0.63), TN and NO3 (r = 0.76) have a positive correlation and TN and flow (r = -0.5) has a negative correlation, which is similar to the outcome of PC1 result for Gab-cheon. Additionally, a similar result was found for Miho-cheon. COD & BOD (r = 0.92), COD & pH (r = 0.59) has a positive correlation, similar result with PC1 of Miho-cheon. In a similar manner, all the correlation result supports the PCA result.
4. Conclusions
In the Geum River, the water quality variation is evident, especially algal bloom is high in the downstream of the river. The summer season is the major factor for the proliferation of algae due to the high flow season paired with an influx of nutrients, creates a favorable condition for algae to proliferate quickly. In the downstream of the Geum River, TP is identified as a limiting nutrient for the growth of algae based on the correlation analysis and the N: P ratio analysis.
PCA analysis was used for pollutant source identification from the major tributaries of the Geum River. PCA identified three pollution sources for Gab-cheon basin as WWTP, urban, and agriculture, and also three sources for Miho-cheon as urban, agriculture, and forest. Therefore, it seems the three major pollutant sources in Gab-cheon and Miho-cheon are the most important factors for the water quality deterioration of the Geum River. Thus, controlling these major pollutant sources should be the priority measure for recovering the water quality of the Geum River. Therefore, reducing the loading of TP from the major pollutant sources of the two tributaries might greatly improve the algal bloom in downstream of the Geum River.
In conclusion, this study has shown the advantage of multivariate statistical models for analysis and interpretation of complex data sets for pollution source identification for an integrated approach to develop management alternatives of water quality in the Geum River. It is believed that this study shows a legitimate approach that can be applied to any such system.