

1. Introduction
2. Methodology
2.1 Study Area
2.2 Model description
2.3 Data preparation
3. Results
4. Discussion and limitations
5. Conclusion
1. Introduction
Freshwater is a crucial ecosystem service sustaining human life and biodiversity. Of the total water on the earth, only 3% of the water on the surface is fresh and the remaining 97% is on the ocean. Of freshwater, 69% is trapped in glaciers, 30% is underground and less than 1% (nearly 0.007% of all water on earth) is available in lakes, rivers and swamps for direct human uses (Ebrahimi et al., 2011). Though very limited, these freshwaters are an important ecosystem service that contributes to the welfare of society in many ways ensuring the development of irrigation, agriculture, increased population, improved living standards, industry and tourism activities (Cudennec et al., 2007). Water yield (WY) is defined as the total amount of water that runs off the ground (Sharp et al., 2018). Maps of where water used for different facilities like water supply, irrigation, hydropower etc. are generated helps planning and management as well, it helps to avoid unintended impacts on provision and production of services.
Facilities like water supply, hydropower, irrigation etc. are designed to account for annual variability in water volume, given the likely levels for a given basin but are equally vulnerable to extreme variations caused by Land Use and Land Cover (LULC) changes (Sharp et al., 2018). LULC change has direct impacts on ecosystems and their associated services, particularly on WY. Fluctuations on WY impacts the hydrological balance of the basin. Sharp increase may cause flooding and decrease may result in water scarcity (De Groot et al., 2002). Likewise, studies have demonstrated that LULC change can alter the hydrologic cycle, affecting patterns of evapotranspiration, infiltration and water retention, (DeFries and Eshleman, 2004; Foley et al., 2005; Woldesenbet et al., 2017) changing the timing and volume of water that is available for services like dams, water supply or hydropower production (World Commission on Dams 2000; Ennaanay, 2006). Thus, recognition of ecosystem services based on land use types is crucial for the sustainability of the provision of services.
Interest in measuring ecosystem services have increased dramatically in recent years (Daily, 1997; MA, 2005). Ecosystem services entailing freshwater (e.g., flood control, the provision of hydropower, and water supply), as well as carbon storage and sequestration, have received the greatest attention in both scientific and on-the-ground applications (Vigerstol and Aukema, 2011). Various hydrological models like Soil and Water Assessment Tool (SWAT) (Arnold et al., 1998; Arnold and Fohrer, 2005), Precipitation Runoff Modelling System (PRMS) (Leavesley et al., 1983) and mapping tools like InVEST, Artificial Intelligence for Ecosystem Services (ARIES) (Villa et al., 2009) etc. are in wide use. The selection of model depends on data availability, user expertise and desired outputs. If the users are interested in comparing multiple ecosystem services on various scenarios or are interested in a quick examination of specific hydrological services requiring minimal data, the simplified ecosystem services specific tools like InVEST or ARIES are most appropriate (Vigerstol and Aukema, 2011).
The study area, Bagmati basin of Nepal incorporates capital city Kathmandu and major cities like Bhaktapur and Lalitpur in the upper part of the basin. As a result, service and facilities like education, health, economic activities are centralized and hence, anthropogenic activities are ever-increasing. LULC conversion is prominent and the provision of ecosystem services is on the verge of deterioration. In the recent decade, the basin has faced severe problems due to urban flood, inadequate water supply and the issues like unsystematic irrigation is hampering the crop production. This study was thus initiated in Bagmati basin to evaluate the total WY and to study the impacts of LULC conversion on it. Many researchers have studied impacts of landuse change on flow of Bagmati basin using sophisticated tools like SWAT (Pokhrel, 2018; Davids et al., 2018). The focus of most of the study has been on total discharge or WY response to typical LULC types such as forest or built-up area but little attention has been given to the quantitative evaluation of WY capacities of different LULC types. In this context, the objectives of this study are: 1) to estimate the total WY of the basin along with computation on a sub-basin scale and 2) to determine the water yield based on land use and land cover types. The quantification of WY based on individual LULC type improves the predictability of WY response to LULC dynamics which promotes future integration of LULC planning and water resources management.
2. Methodology
2.1 Study Area
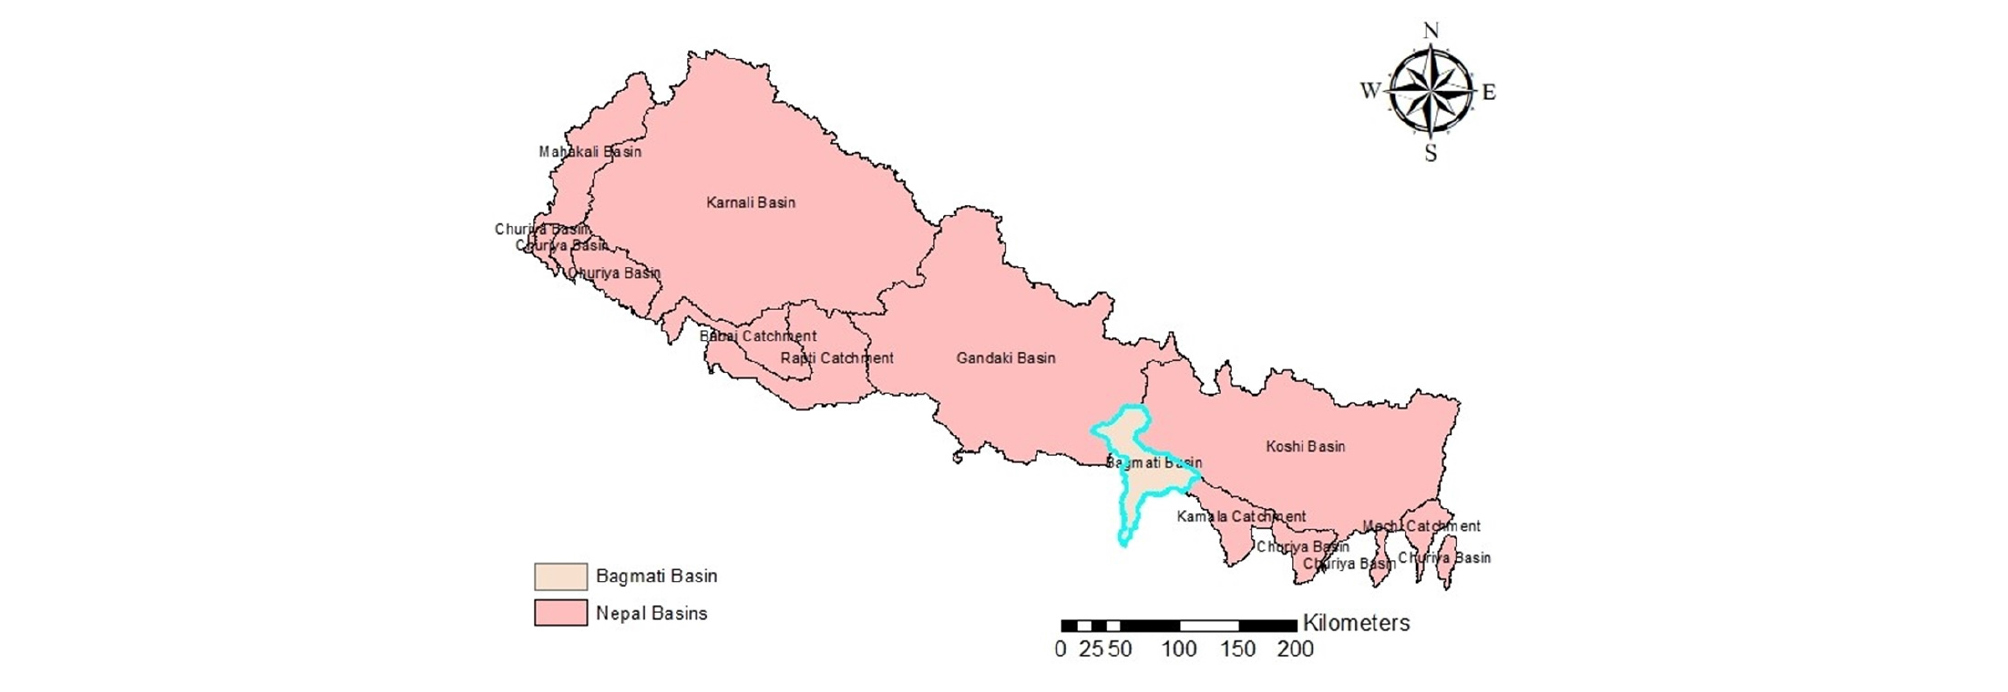
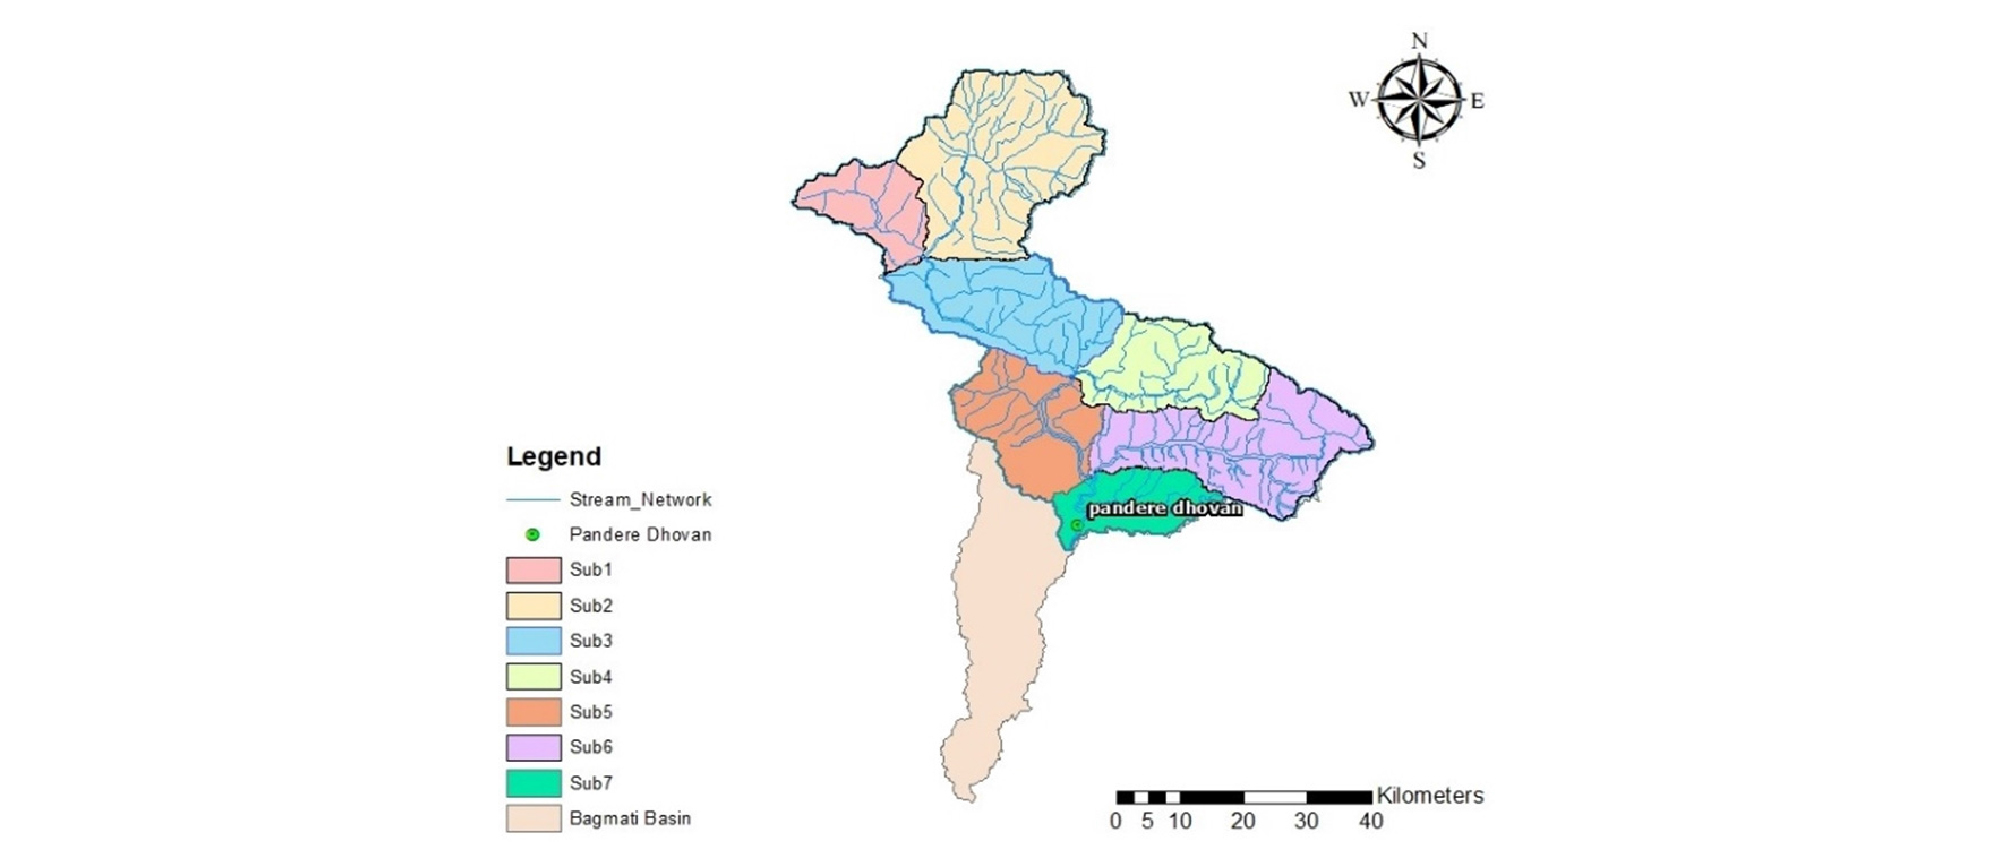
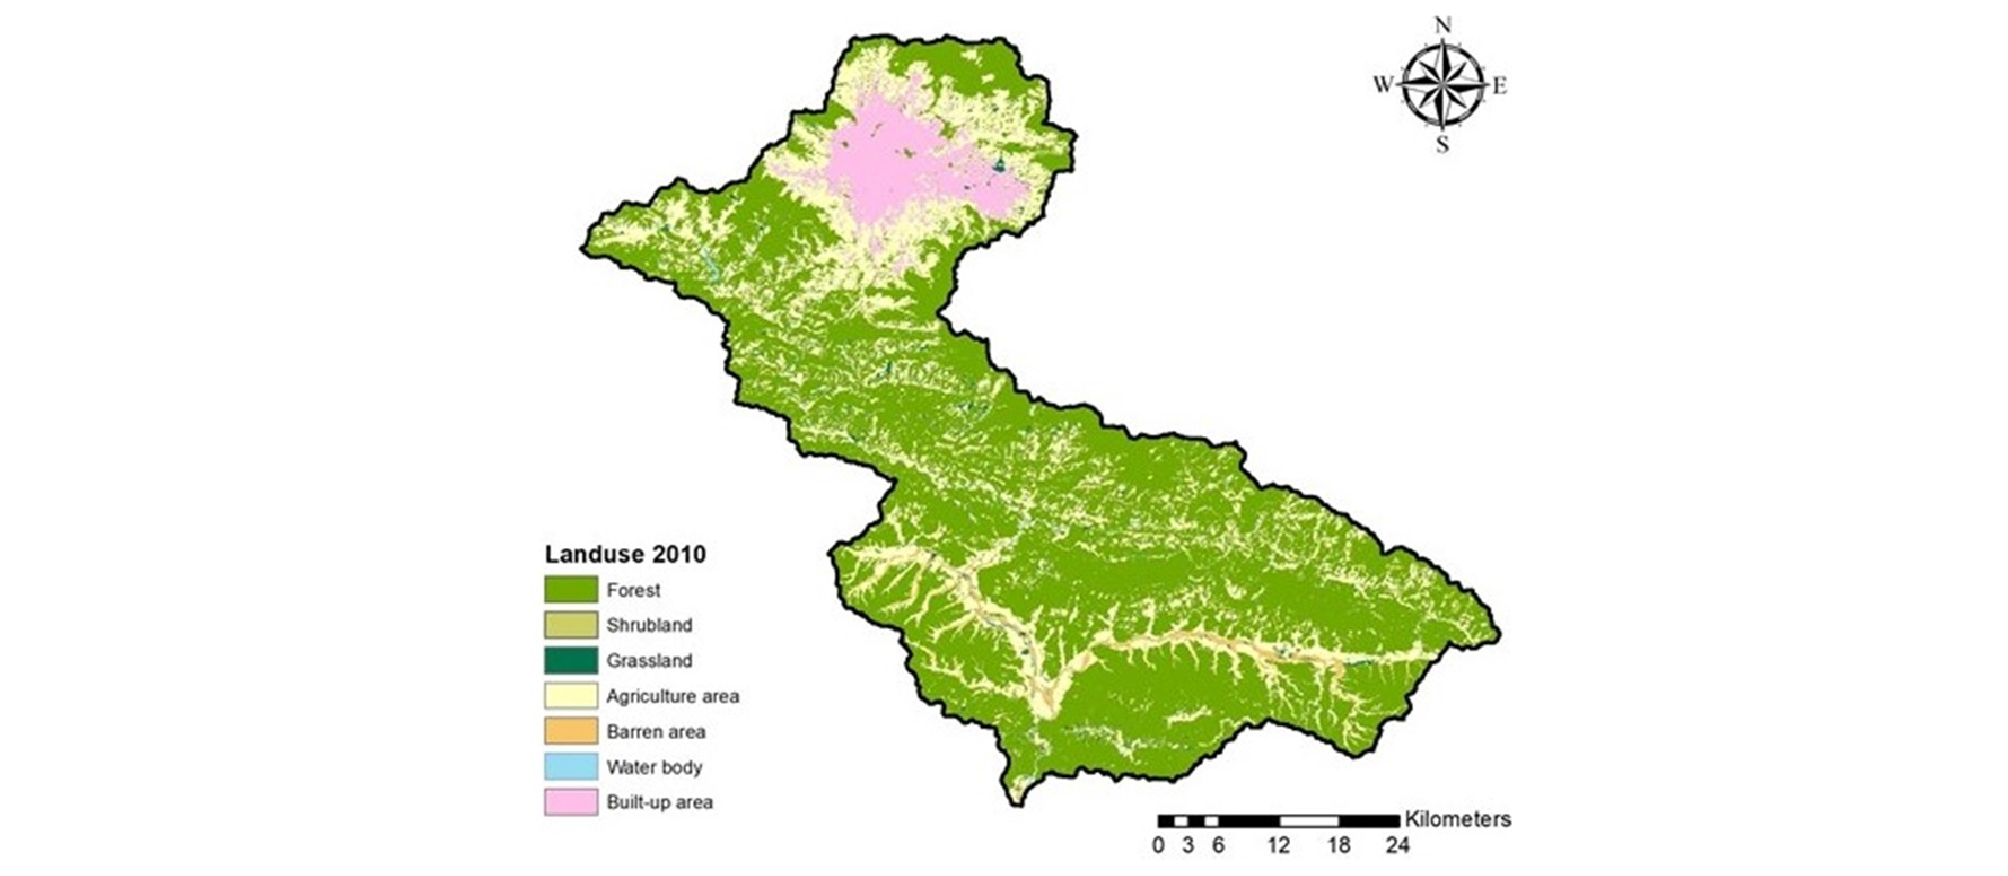
The study area, Bagmati Basin lies at middle mountain region of Nepal at latitude 26°42´ to 27°50´ N and longitude 85°22´ to 85°58´E with a total area of 3750 km2 (Fig. 1). The Bagmati river originates from the north of capital city Kathmandu at Shivapuri (Bagdwar) at an altitude of 2,690 m. It consists of many tributaries such as Bishnumati, Manohara and Tukucha. Bagmati is a spring and monsoon rain-fed river. For the study, only the area above Pandere Dhovan gauge station is considered owing to good data availability, thus for study 2768.917 km2 area is considered which is shown in Fig. 2. The upper part of the basin covers the whole of Kathmandu valley. The lower part of the basin is comparatively flat than the upper part. As well, according to LULC map (Fig. 3), cultivated land is dominant in the upper part of basin whereas, in the middle and lower part of basin, the forest is dominant. As the capital city lies in the upper part, most of the built up area of basin is concentrated on upperpart.
2.2 Model description
The Integrated Valuation of Environmental Services and Tradeoffs (InVEST) is a suite of free and open-source software (NatCap Project, 2018) developed by the natural capital project of Stanford University. The models are designed to inform decisions about natural resource management. InVEST’s modular design provides an effective tool for exploring the likely outcomes of alternative management and climate scenarios and for evaluating trade-offs among sectors and services.
The InVEST WY model is based on the Budyko hydrological method and estimates the relative contributions of water from different parts of a landscape, offering insight into how changes in landuse patterns affect annual surface WY and related services (Sharp et al., 2018). The model runs on a gridded map and it represents explicitly the spatial variability in precipitation, potential evapotranspiration (PET), soil depth, and biophysical characteristics of different LULC. It acquires input on raster format and produces spatially explicit output which can be interpreted in ArcGIS for various scenario comparisons.
For this study, WY model of InVEST 3.6.0 version is used. The model is based on the Budyko curve and annual average precipitation. The annual WY Y(x) for each pixel on the landscape x is determined as Eq. (1) (Sharp et al., 2018).
| $$Y(x)=\left(1-\frac{AET(x)}{P(x)}\right)\ast P(x)$$ | (1) |
where AET(x) is the annual actual evapotranspiration for pixel x and P(x) is the annual precipitation on pixel x. For vegetated LULC types, the evapotranspiration portion of the water balance, is based on an expression of the Budyko curve proposed by Fu (1981) and Zhang et al. (2004) given as Eq. (2).
| $$\frac{AET(x)}{P(x)}=1+\frac{PET(x)}{P(x)}-\left[1+\left(\frac{PET(x)}{P(x)}\right)^\omega\right]^{1/\omega}$$ | (2) |
Here, PET(x) is potential evapotranspiration calculated as Eq. (3) as defined in user guideline (Sharp et al., 2018), ω(x) is a non-physical parameter that characterizes the natural climatic-soil properties.
| $$PET(x)=Kc(l_x)\;\ast\;ET_0(x)$$ | (3) |
Where, ET0 (x) is the reference evapotranspiration from pixel x and Kc (lx) is the plant evapotranspiration coefficient associated with the LULC lx on pixel x.
ω(x) is an empirical parameter and is determined as the expression proposed by Donohue et al. (2012) as Eq. (4) below.
| $$\omega(x)=Z\frac{AWC(x)}{P(x)}+1.25$$ | (4) |
It is related to plant available water content (PAWC), precipitation and the Z constant which captures the local precipitation pattern and additional hydrogeological characteristic (Sharp et al., 2018). AWC(x) is the volumetric (mm) plant available water content.
2.3 Data preparation
The InVEST WY model requires data on precipitation, land use and land cover, average annual potential evapotranspiration, soil depth, plant available water content, watersheds, sub watersheds, a bio-physical table with attributes of each land use and land cover, and the seasonality factor Z.
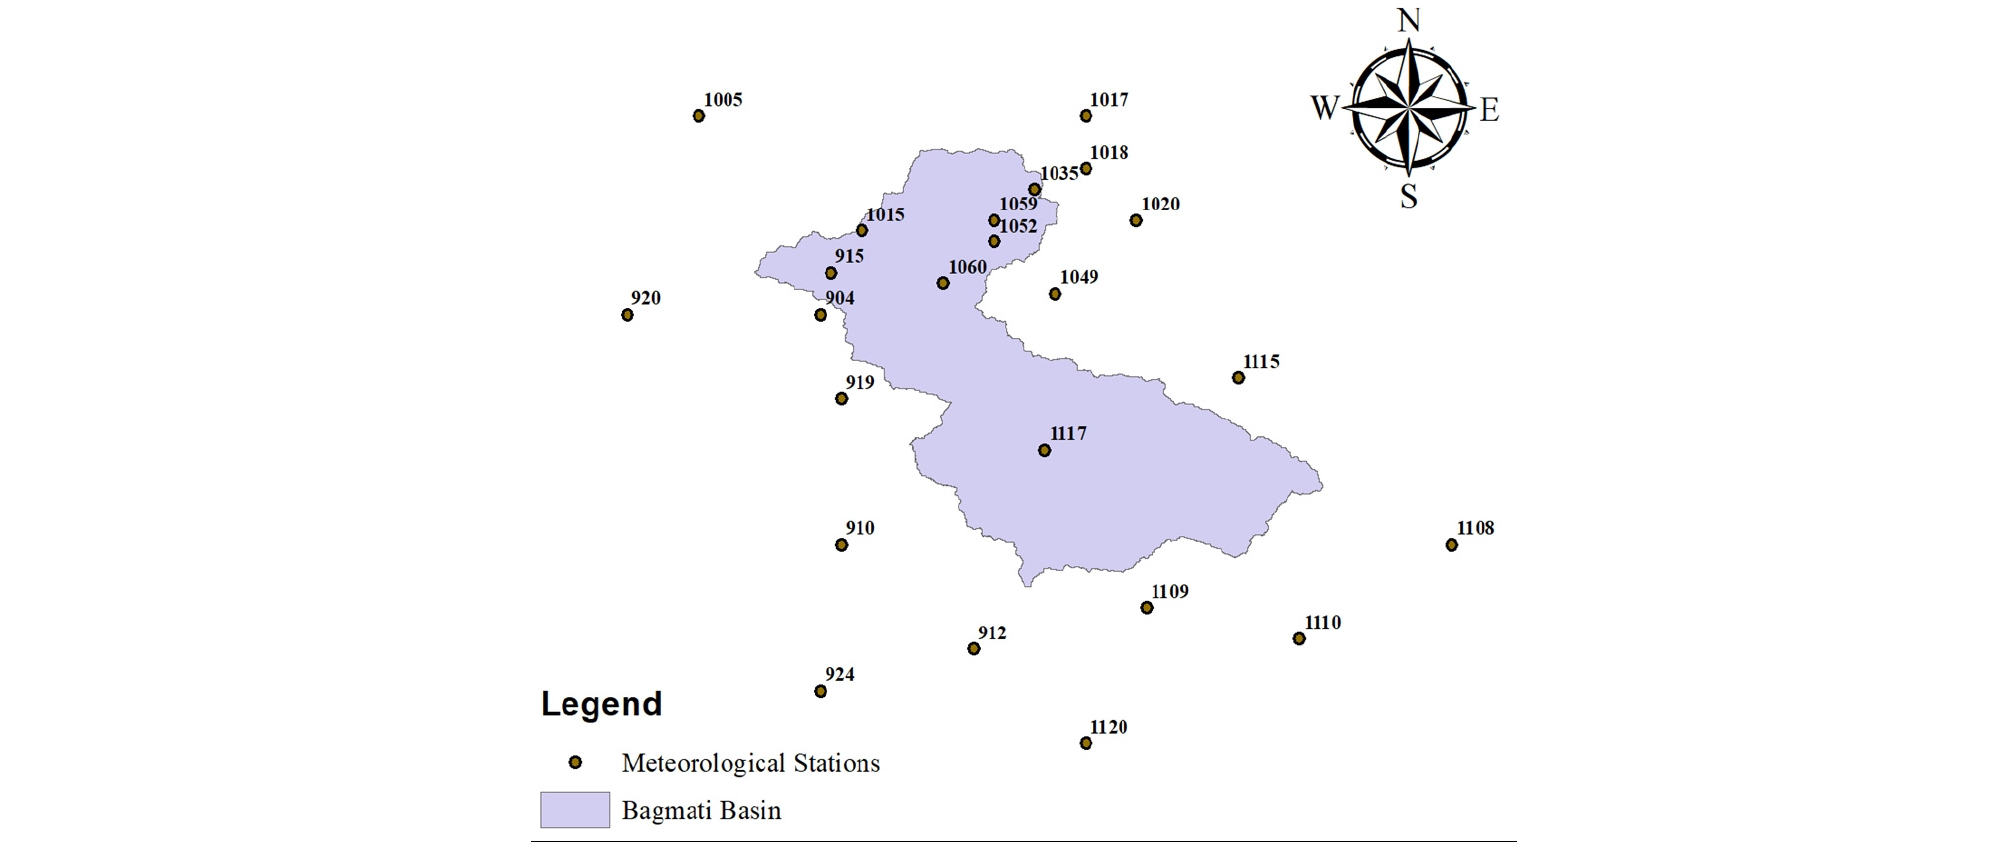
Daily rainfall and temperature data of 23 meteorological stations in and around Bagmati basin (Fig. 4) for 30 years, 1984-2013 was obtained from Department of hydrology and meteorology (DHM), Nepal. The annual mean precipitation raster was generated using an ordinary method of Kriging interpolation method in Arc GIS. This study assumed constant unknown mean only over the search neighborhood of the estimation location. In this regard, the ordinary Kriging was selected in this study. The temperature-based Hargreaves equation was used to compute reference evapotranspiration as it generates superior results than the Pennman-Montieth method given the limited long-term data (Hargreaves and Samani, 1985). The Hargreaves equation is given as Eq. (5).
| $$ET_0=0.0023\ast R_a\ast\left[\frac{T_{max}+T_{min}}2+17.8\right]\ast(T_{max}-T_{min})\;^{0.5}$$ | (5) |
Where Ra is extraterrestrial radiation (in mm/day), Tmax is daily mean maximum temperature and Tmin is daily mean minimum temperature in degree Celsius.
Landuse and landcover map of 2010 is obtained from the ICIMOD Nepal Geospatial Portal, regional database system which is prepared using public domain Landsat TM data (ICIMOD, 2018). LULC of the study basin consists of 7 attributes; Forest, grassland, shrubland, agriculture, built-up, waterbody and barren land.
A GIS raster dataset with an average soil depth value for each cell was generated based on Soil and Terrain (SOTER) database of Nepal. SOTER for Nepal is available from the International Soil Reference and Information Centre, ISRIC data hub (ISRIC Data Hub, 2017). Plant available water content (PAWC) is a fraction obtained from the standard soil map. It is the difference between the fraction of volumetric field capacity and permanent wilting point. It is obtained by dividing volumetric value (mm) of plant available water content by soil depth.
Based on a digital elevation model (DEM) the basin and sub-basins were generated using ArcSWAT and required shapefile formats. Each sub-basin was given only one identification number. The whole basin is delineated on 7 sub basins.
The biophysical table reflects the attributes of each LULC type containing LULC code, descriptive name of LULC, the maximum root depth for vegetated land use classes in millimeters and the plant evapotranspiration coefficient for each LULC class. The root depth of main vegetation types was obtained following Chen et al. (2008). As well, the evapotranspiration coefficient of each LULC type is based on Allen et al. (1998) and the InVEST user guide. The Z value was tested and verified based on 10 years average annual streamflow.
3. Results
The results of WY are highly affected by the value of Z parameter which represents hydrogeological characteristics of the basin. For the validation of the model, as per user guideline of InVEST WY model, the total annual WY is compared with observed streamflow at the outlet of basin. The total simulated WY of the basin is 3.380*109 m3 which is very close to the amount of 3.375*109 m3 which is 10 years average annual streamflow at the outlet stream gauge station. The WY is computed on a sub-watershed scale (Fig. 5). Having greatest area, sub-basin 2 has the highest WY volume of 7.82*108 m3 and sub-basin 7 with the lowest area has the lowest WY volume of 2.6*108 m3. WY per hectare is highest on sub-basin 5 (15216.32 m3/ha) and lowest on sub-basin 6 (10847.15 m3/ha). The Bagmati Basin is rain-fed basin and the highest WY per hectare on sub-basin 5 is directly related to the highest precipitation compared to other basins. Fig. 5 shows WY distribution throughout the basin, whereas Table 1 and Fig. 6(a) represents WY value and on each sub basins.
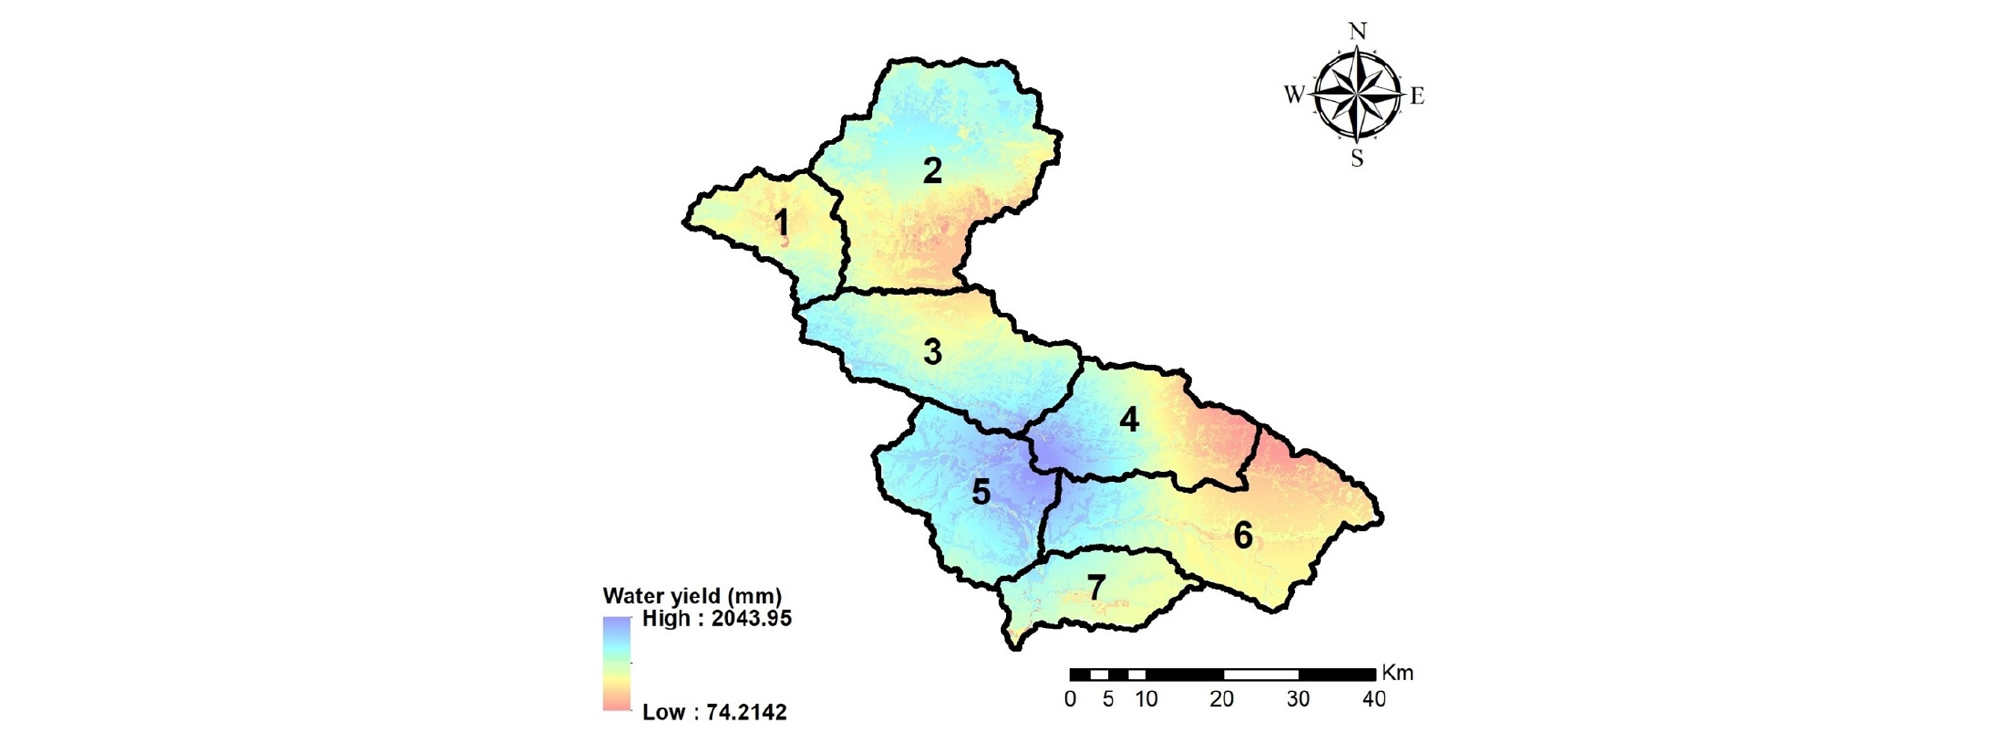
Table 1. Sub-basin (SB) wise WY distribution
The annual WY shows considerable variation with respect to various kind of LULC. WY per hectare is highest on the built-up area (13231.21 m3/ha) and lowest on water body (6718.37 m3/ha). Table 2 and Fig. 6(b) shows the WY capacities of different LULC of the basin. Sub-basin 1 and sub-basin 2 has similar intensity of rainfall but WY per hectare is significantly high on sub-basin 2 compared to sub-basin 1. The concentration of built-up area on sub-basin 2 is the cause of increased WY as the potential evapotranspiration is lower. Likewise, agriculture area also has significantly high WY per ha (12798.67 m3/ha). As per landuse map of 2010, 64.45% of the study area is covered by forest area and hence forest has highest WY in terms of volume, followed by agriculture area and built-up area which occupies 25.29% and 6.23% of area, respectively.
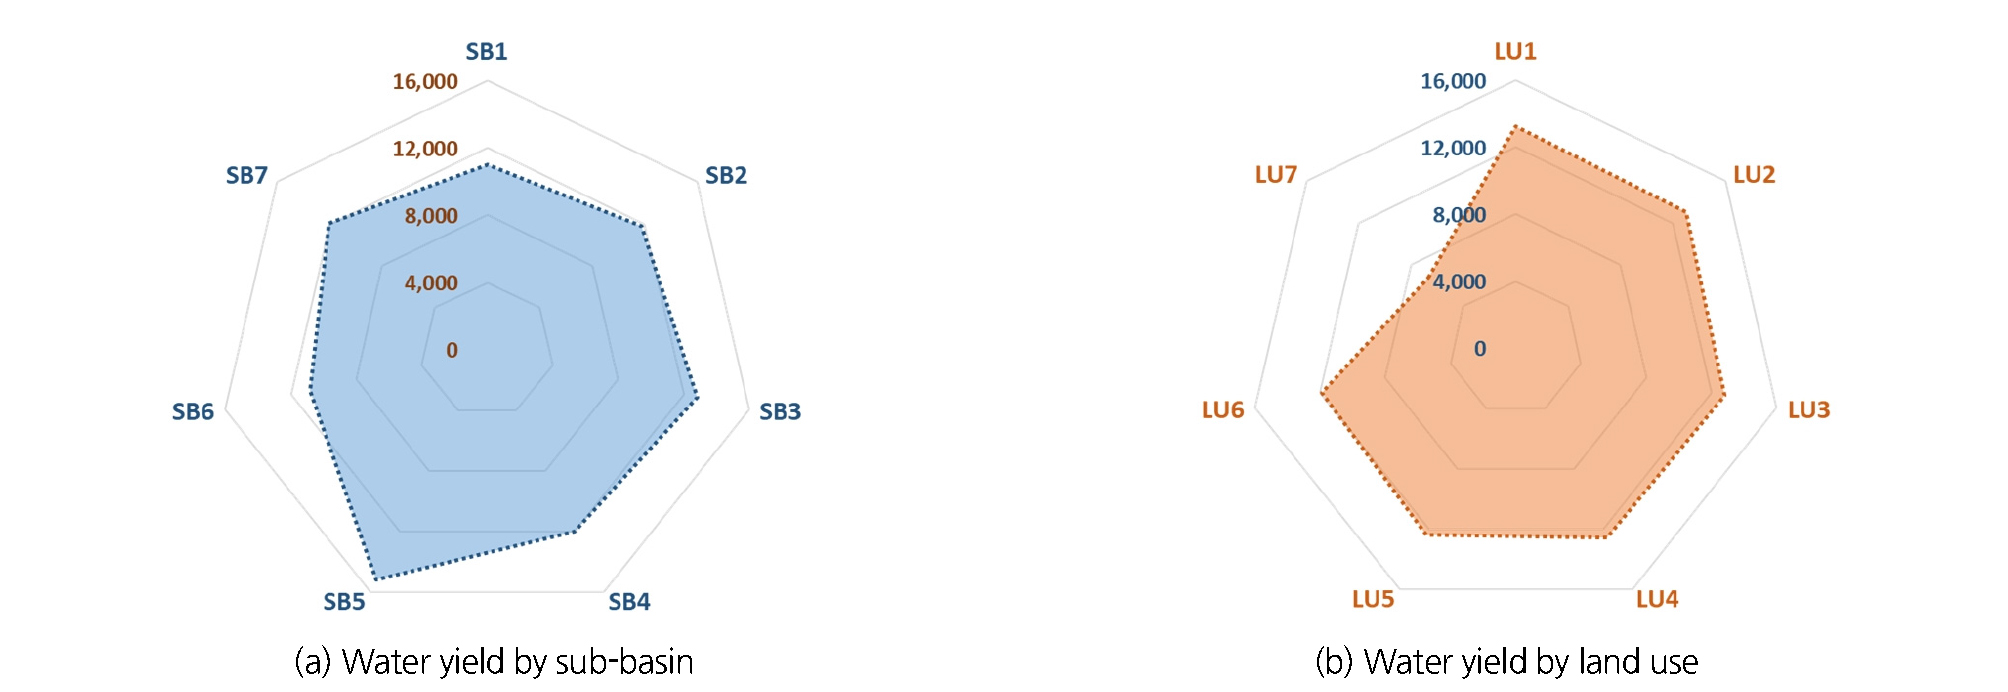
Table 2. WY capacity of each land use and land cover
4. Discussion and limitations
For the spatial mapping of WY in the Bagmati basin, InVEST WY model is applied. The model is based on Budyko theory and it requires low amounts of data, making it superior to other sophisticated models when the objective is to provide information for decision and policymaking on the local scale. Nevertheless, the model is very sensitive to precipitation and evapotranspiration and hence careful selection and preparation of input parameters is must for accuracy of the results. The WY simulated by InVEST represented natural streamflow, however, it is of great importance to note that the observed river flow at the watershed outlet or hydrological station is altered by human activities (Wei and Zhang, 2010). The water extracted for various human uses like for irrigation, industrial purpose or water supply may not flow back to rivers. This part of consumption is not well captured by the InVEST model and it should be recalculated and added as recorded runoff, then resulting in an estimation of the natural runoff (Li et al., 2018).
The subwatershed wise WY results from the model can provide an estimation of water available for different services like water supply, irrigation and hydropower. Maps of where WY used for services are produced can help implementation of better landuse planning for facilities of national priorities and such maps can also be used to inform investments in restoration or management that downstream stakeholders, such as hydropower companies make in hopes of improving or maintaining water yield (Sharp et al., 2018). The InVEST WY model determines the WY in each cell of the landscape as the precipitation minus the actual evapotranspiration which is determined by LULC vegetation characteristics. This phenomenon emphasizes that while precipitation determines how much water is provided by nature, it is the LULC that determines the amount of water converted to WY and water storage. LULC change can modify hydrological regimes of evapotranspiration, infiltration and water retention, and the water available to rivers and groundwater resources (Sanchez-Canales et al., 2012). For example, conversion of vegetated landuse to the built-up area could increase WY intensity, especially during storm periods because impervious surface reduces the infiltration and concentration-time (Liu et al., 2013). Increased WY comes up with high chances of nitrogen export to the streams from agricultural areas and a higher risk of soil erosion during flood periods. Such impacts are also of high concern when evaluating ecosystem services of the watershed. Studies from researchers Yang et al. (2013) and Zhao et al. (2016) also have highlighted that urbanization increases flooding while vegetated land could transfer water to the soil.
This study basically focused on water availability on sub-basin scales with an aim that sub-basin evaluation of water yield can estimate surplus or deficit amount of water required for regional water plans. As well, the quantitative capacities of each LULC for water yield is focused. This study has shown that built-up area has highest WY and vegetated land use has the lowest WY capacity. For the optimum utilization of WY at present, well-positioned infrastructure for water collection, delivery and treatment are necessary. The WY if not maintained systematically, increases floods and water scarcity problems. In recent years, urban flooding and water shortages are the frequent cases on the upper part of Bagmati basin which has come up as a cost of rapid urbanization and insufficient stormwater management facilities. As Nepal is a growing economy and infrastructural development or on verge of blooming, priorities should be given to ecosystem-based “green” infrastructures, such as wetlands, well-structured soils, and forest patches, which could greatly enhance water storage and flood regulation in long term period. WY capacities of each LULC and sub basins can provide an overview of regional WY and hence can facilitate future landuse, infrastructure and water resources management.
Though a relatively new model, InVEST models are widely applied to evaluate ecosystem services under various scenarios. The model is very sensitive to input parameters and careful attention have been given on preparation of data based on previous studies and comparison with observed data. Still, there some uncertainties resulting from the model itself. It is based on annual averages, which neglects extreme events. The model assumes all WY from a pixel reaches the point of interest, and therefore does not distinguish between surface and sub-surface water. Also, the model does not consider complex land use patterns and underlying geology, which may induce complex water balances. Also, the detail sensitivity analysis of the parameters and validation with comparison to results of other hydrological models is needed for accurate results. Despite model and data limitations, the results from the study provide an overview of general tendency and are expected to help in decision making and scenario analysis.
5. Conclusion
The provision of fresh water is an ecosystem service that contributes to the welfare of society in many ways including water supply, irrigation and hydropower production. Most of these services come from the watershed-fed system. Calculation and mapping of water yield is thus of great importance for design, protection and sustainable management of water resources and related facilities. In this study, sub-basin wise and WY capacity of each LULC of the Bagmati basin is computed using InVEST WY model. The model is based on simple Budyko hydrological process and requires data on precipitation, evapotranspiration, LULC, soil depth, plant available water content and a biophysical table reflecting the attributes of each LULC. The total annual WY was estimated to be 3.38*109 m3 and sub-basin 5 has the highest WY followed by sub-basin 3 and sub-basin 7. The analysis of the WY capacity showed that the built-up LULC has highest WY followed by the grassland and the agriculture area. The information on WY capacity of basins and each LULC can be used for prediction of surplus or deficit WY in future landuse scenarios. The sub-basin wise WY computation is expected to assist management of small water supply, flood control as well as hydropower production in the area. Also, the LULC specific WY estimations can be used to evaluate benefit-cost ratio between development works and environment protection. Thus, the outcomes of this study are expected to assist future land-use and water-related ecosystem services management.
