

1. Introduction
2. Study Area
3. Datasets
4. Methods
4.1 Data assimilation for enhanced SAR S1 SWI
4.2 Parameterized SM2RAIN for SAR S1 rainfall estimation
4.3 Performance evaluation
5. Results and Discussions
5.1 Satellite rainfall estimation from SAR S1 (SM2RAIN-S1 product)
5.2 Evaluation of the SM2RAIN-S1 rainfall product
6. Conclusions
1. Introduction
Accurate estimation of terrestrial rainfall at high-spatial-resolution (~ 1 km) can significantly contribute to the improvement of hydro-meteorological and agricultural applications, especially for the demands of urban hydrology and microscale agriculture (Fletcher et al., 2013; Hong et al., 2021). Satellite rainfall products (SRPs), normally retrieved from microwave satellite sensors with their large coverage, provide a more convenient and beneficial measurement way for large-scale rainfall variability compared to the traditional ground-based observing systems (e.g., rain gauges and weather radars) across the poorly gauged and complex terrains (Sun et al., 2018; Tang et al., 2020), since those traditional observing systems are restricted in spatial coverage.
In general, researchers mainly focused on two major methods to retrieve SRPs from microwave satellites. Several common SRPs such as the Tropical Rainfall Measuring Mission Mulitsatellite Precipitation Analysis (TMPA) or the Integrated Multi-satellitE Retrieval for Global Precipitation Measurement (IMERG) were obtained using the “top-down” approach, which directly converts the observed microwave satellite signals into rain rate measurement (Trenberth and Asrar, 2014). The so-called “bottom-up” approach, which allows the retrieval of terrestrial accumulated rainfall based on observed soil moisture, has emerged as a novel and effective method that can compensate for the limitations of the traditional “top-down” approach (Brocca et al., 2014). Particularly, the inversed water balance model-based SM2RAIN algorithm (Brocca et al., 2013) was gained more attractive among the “bottom-up” approaches due to its novelty, simplicity, and physical modelling. The feasibility of SRPs based on the SM2RAIN model was evaluated from regional to global scales with a variety of satellite soil moisture products (Brocca et al., 2014, 2016, 2019; Koster et al., 2016; Ciabatta et al., 2018), demonstrating the practical application of this model worldwide. Moreover, the “top-down” and “bottom-up” approaches were merged to provide complementary SRPs (Ciabatta et al., 2015; Zhang et al., 2020). A self-calibrated (parameterized) SM2RAIN model was recently developed by Filippucci et al. (2021) to overcome the need for a SM2RAIN calibration that has a high computational cost. The reasonable evaluation results of this modified version at a global scale support the use of well-developed parameters from the self-calibrated SM2RAIN model for local applications over different climatic regions and vegetation covers.
A serious limitation related to the common microwave satellite sensors used for both rainfall and soil moisture measurements, on the one hand, is that their coarse spatial resolution of a few ten kilometres is not adequate for small-scale applications. Moreover, the quality of finer spatial resolution products obtained using statistically downscaling the coarser spatial resolution products is still unsatisfactory, while physical processes cannot be revealed with these statistical methods (Chen et al., 2018; Reichstein et al., 2019). For the satellite rainfall estimation, retrieval of reliable high-spatial-resolution (~ 1 km) SRPs based on physical models are still an essential problem. On the other hand, in terms of soil moisture, the Synthetic Aperture Radar (SAR) remote sensing systems offer an alternative tool for mesoscale monitoring via their high-spatial-resolution. Among them, the C-band SAR Sentinel-1 satellite constellation (S1), which includes two satellites sharing the same orbit, the Sentinel-1A (S1A) and Sentinel-1B (S1B), has been recently strongly focused. Numerous previous studies took into account the high-spatial-resolution S1 soil moisture, especially the 500-m and 1-km products (Nguyen et al., 2021, 2022; Bauer-Marschallinger et al., 2018; Balenzano et al., 2021) since they were reported as adequate scales for minimizing basic SAR uncertainties (Bauer-Marschallinger et al., 2018). The availability of those various high-spatial-resolution S1 soil moisture products and the successful applications of the SM2RAIN to satellite radar systems (Brocca et al., 2016; 2019) encouraged extending the SM2RAIN application to the SAR S1 constellation to generate high-spatial-resolution terrestrial rainfall product.
Overall, this study aims to provide a local preliminary assessment of a high-spatial-resolution (0.01° or ~ 1-km gridded) terrestrial rainfall product’s performance, which was derived by applying the SM2RAIN model to the C-band SAR S1 satellite data (hereafter the SM2RAIN-S1 product). This assessment was conducted over Central South Korea since there is a significant difference between the two sub-regions in this area, the middle sub-region with mixed forest-dominated land cover and the west coast sub-region with cropland-dominated land cover. Information obtained in this region with the SM2RAIN-S1 product can boost the better understanding of the “bottom-up” approaches for satellite rainfall estimation and support the development of a complementary high-spatial-resolution SRP for the entire South Korea.
2. Study Area
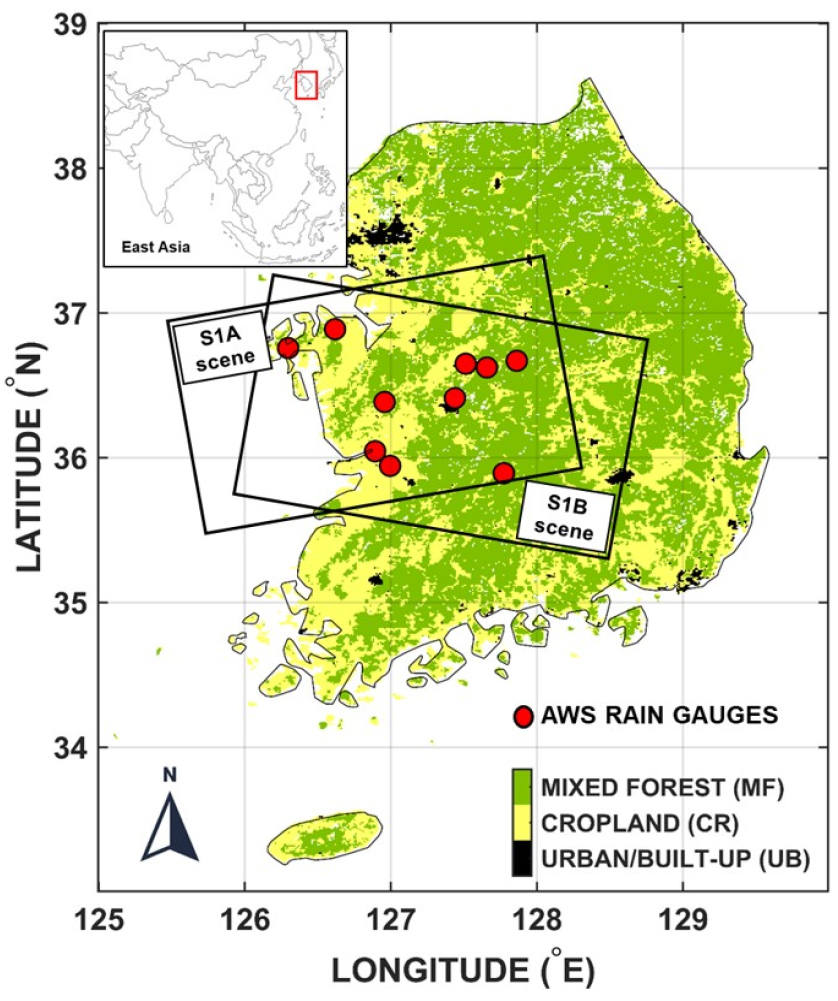
Central South Korea was selected as the targeted study area in this research. In general, South Korea has an annual average rainfall of 1000-1800 mm; and is considered as a monsoon-dominated climate country (Nguyen et al., 2017), since most of the precipitation falls during summer (June-September) under the Changma monsoon’s effects (https://web.kma.go.kr/eng/biz/climate_01.jsp). Over Central South Korea, two sub-regions were considered: (1) the middle sub-region with a dominated land cover of mixed forests (MF), and (2) the west coast sub-region surrounding the Yellow Sea and covering the Geum river basin with a dominated land cover of croplands (CR). Moreover, a 1-year study period of 2020 was considered, since this year has been reported with heavy rains and floods during the summer season. Fig. 1 provides more details on the coverage and distribution of the selected dataset as well as the land cover classification map from the Global 1-km Consensus Land Cover (GCLC) product (Tuanmu and Jetz, 2014) for Central South Korea.
3. Datasets
The C-band SAR Sentinel-1 constellation (S1) used in this study is a combination of two active microwave SAR satellites, the S1A and S1B, co-operated by the European Space Agency and the European Earth Observation Copernicus. Global radar backscatter (σ°) observation at high-spatial-resolution (20 × 22 m) for dual-polarization (VH and VV) can be retrieved from the Interferometric Wide Swath and Ground Range Detected (IW-GRD) mode of the S1 within a 6-day repeat cycle when both S1A and S1B are used. In this study, we utilized only the VV data from both S1A and S1B images covering Central South Korea (Fig. 1) during the year 2020, since it showed a stronger correlation with surface water content compared to the VH data (Nguyen et al., 2021). Moreover, before their further uses, a standard pre-processing steps series with bilinear interpolation spatial resampling methods were first applied to the raw S1 data to derive the high-spatial-resolution 0.01° gridded σ° data. Finally, a simple local incidence angle normalization (LIA-norm.) and threshold-based masking methods following Bauer-Marschallinger et al. (2021) were subsequently adopted to the pre-processed 0.01° gridded σ° data to minimize the effects of LIA variation and mask the unnecessary backscatters from permanent water bodies.
Auxiliary information on land descriptors including rainfall and soil moisture for computing the SM2RAIN parameters and enhancing the S1 soil moisture estimation can be provided from the reanalysis products. For this purpose, we considered rainfall and soil moisture datasets from the conventional 5th European Centre for Medium-range Weather Forecasts Reanalysis-land version (ERA5-Land) product, which is distributed by the Copernicus Climate Change Service (Hersbach et al., 2020). In particular, hourly 0.01° gridded ERA5-Land accumulated rainfall and volumetric soil water dataset at the first soil layer (0-7 cm depth) were initially retrieved and then resampled to the daily interval. Moreover, to match the S1 data, we only selected the subset of ERA5-Land data covering Central South Korea in 2020, which overlapped the scenes of both S1A and S1B.
For evaluation of the SM2RAIN-S1 performance in terms of temporal dynamics, rainfall data obtained from the 0.5 mm tipping-bucket rain gauges belonging to the Automated Weather Station (AWS) network monitored by the Korea Meteorological Administration (KMA) can be considered as the ground-truth product. In this research, we employed daily accumulated rainfall observational data in 2020 for ten selected KMA rain gauge stations located in Central South Korea, with their related information provided in Table 1.
Table 1.
Related information for each selected rain gauge and each sub-region in Central South Korea
4. Methods
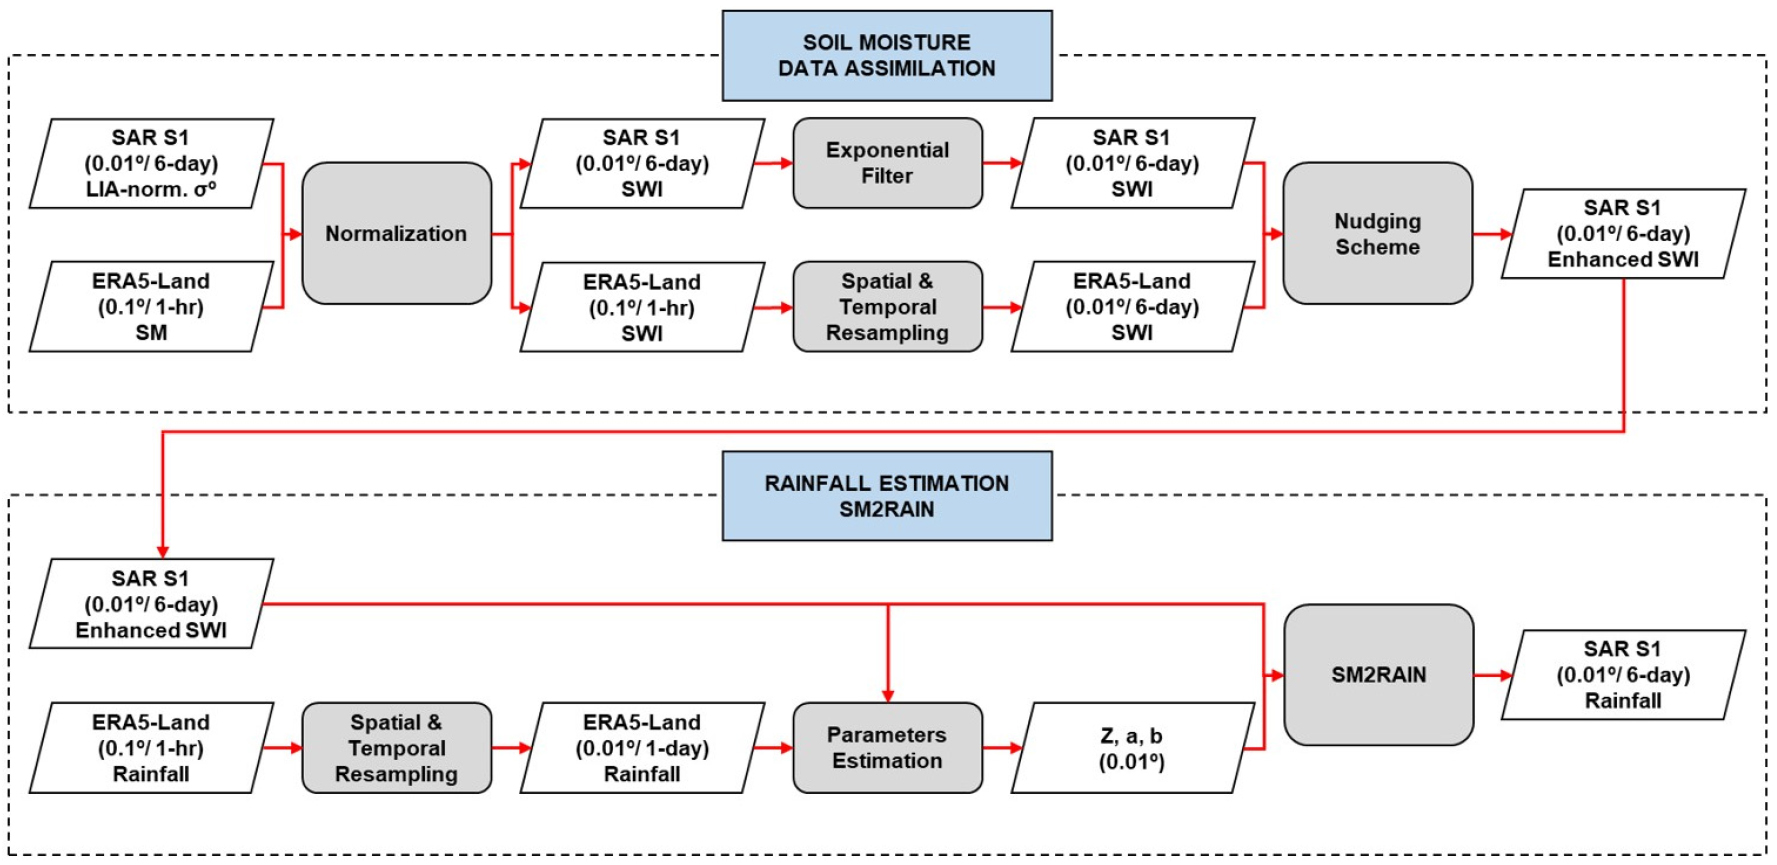
Fig. 2 shows a flowchart of the major procedure for this study, consisting of two steps: (1) the novel enhanced SAR S1 soil moisture estimation via data assimilation and (2) the high-spatial-resolution (0.01° grid) satellite rainfall estimation from the enhanced S1 soil moisture product using the recently developed self-calibrated SM2RAIN model.
4.1 Data assimilation for enhanced SAR S1 SWI
The ERA5-Land soil moisture dataset was utilized for enhancing the soil moisture retrieval from the S1 σ° signal. First, the pixel-based absolute values of ERA5-Land soil moisture and S1 σ° were rescaled to the relative soil moisture, expressed as the Soil Water Index (SWI) ranging between 0 and 1, using the simple maximum-minimum normalization over the study period as:
in which X denotes the absolute values of the S1 σ° and ERA-Land soil moisture, the subscripts max and min denote their corresponding maximum and minimum values, respectively. Second, an exponential filter (Wagner et al., 1999) with a fixed T = 1 was then adopted to the S1 SWI to generate a better filtered S1 SWI product (fSWIS1) with reduced noises. In addition, the daily ERA-Land SWI (SWIERA5) was also aggregated in both temporal and spatial scales to match the fSWIS1 resolution (0.01°/6-day) by using the corresponding average and bilinear interpolation methods. These SWIERA5 and fSWIS1 products at the same temporal-spatial resolutions were finally integrated into an enhanced high-spatial-resolution S1 SWI product following the simple nudging scheme as (Capecchi and Brocca, 2014):
where SWI hereafter stands for enhanced S1 SWI product, and the gain K can be computed as:
with and are the error variances of the SWIERA5 and SWIS1, respectively.
4.2 Parameterized SM2RAIN for SAR S1 rainfall estimation
The enhanced S1 SWI product was subsequently inserted into the SM2RAIN model to generate the SM2RAIN-S1 rainfall product. In general, the SM2RAIN is a simple physical model developed according to the water balance equation as follows:
where SWI(t) stands for the relative soil moisture (herein the enhanced S1 SWI) measured at time t, Z (mm) stands for the soil layer depth multiplied by soil porosity, P(t), R(t), E(t) and G(t) stand for rainfall, runoff, evapotranspiration, and drainage rate, respectively. The major assumption for the SM2RAIN model is that R(t) and E(t) were negligible because of no evapotranspiration during rainfall events and all rainwater infiltrated into the soil, while the drainage rate G(t) = a.SWI(t)b, Eq. (4) can be rearranged to a simple form as follows (Brocca et al., 2013; 2014):
where Pest stands for the estimated rainfall using the SM2RAIN (herein the SM2RAIN-S1 product), a (mm/day) is the saturated hydraulic conductivity while exponent b controls the drainage rate. In this research, the self-calibrated SM2RAIN model (Filippucci et al., 2021), which was proved with a relatively good performance over global evaluation, was selected to derive the SM2RAIN-S1 product instead of the traditional high computational version. The three major parameters in the SM2RAIN models can be computed as (Filippucci et al., 2021):
where μ denotes the annual daily average value, and P stands for the daily accumulated rainfall data obtained from the auxiliary ERA5-Land product.
4.3 Performance evaluation
Overall performance of the SM2RAIN-S1 rainfall product was validated for both spatial and temporal variability. For the spatial variability, the ERA5-Land rainfall product was selected as a benchmark to conduct this evaluation. Daily ERA5-Land rainfall was then resampled to a 6-day accumulated rainfall product to match the S1 temporal resolution. However, since the SM2RAIN-S1 rainfall was not bias-corrected to the ERA5-Land rainfall, only the Pearson’s correlation (R) map between these two rainfall products was then provided. As regards the temporal variability evaluation, rainfall data retrieved from the selected KMA rain gauge stations were then employed. Specifically, R, Root-Mean-Square Error (RMSE), and Bias values computed when comparing the SM2RAIN-S1 rainfall against the rainfall data from selected rain gauge stations were employed as the major metrics for temporal variability evaluation. The SM2RAIN-S1’s performances over two sub-regions were also compared in this study using these evaluation metrics, where the higher positive R-value (closer to 1), lower RMSE and absolute Bias values can indicate the better ones.
5. Results and Discussions
5.1 Satellite rainfall estimation from SAR S1 (SM2RAIN-S1 product)
5.1.1 Overview of the wetness conditions and parameters estimation
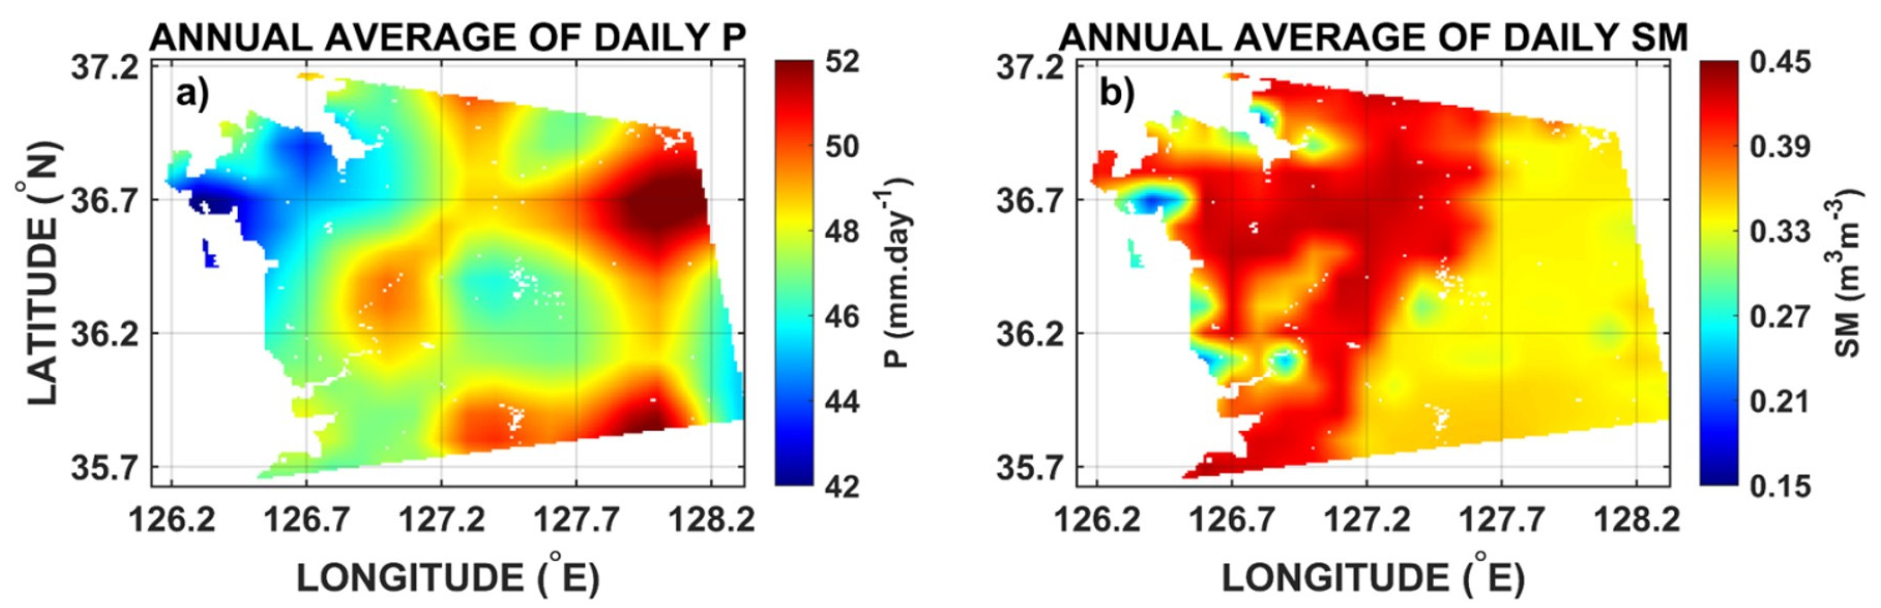
Daily rainfall and soil moisture data retrieved from the ERA5-Land product can be considered as a benchmark for providing a general overview of the wetness conditions in Central South Korea, and their spatial maps in 2020 were shown in Fig. 3. In general, there is a clear difference in wetness conditions between the two sub-regions, the middle and west coast of Central South Korea. As can be seen from Fig. 3(a), higher annual average rainfall was observed in the middle sub-region compared to the west coast sub-region. However, as regards the soil moisture (Fig. 3(b)), wetter soil conditions were mainly reported in the west coast of Central South Korea, where cropland is the dominant land cover, rather than the mixed forests-dominated area of the middle sub-region. This opposite trend between rainfall and soil moisture could be because rainfall dynamics are mainly controlled by the monsoon effect while soil moisture variation highly related to the soil conditions and the dominated vegetation covers. Particularly for the west coast sub-region, which is located surrounding the coastal Yellow Sea and covering the Geum river basin with dominated cropland land cover, the higher wetness conditions in this area could be affected by the wetter soil condition near the coast and the increase of artificial soil water amount from human irrigation.
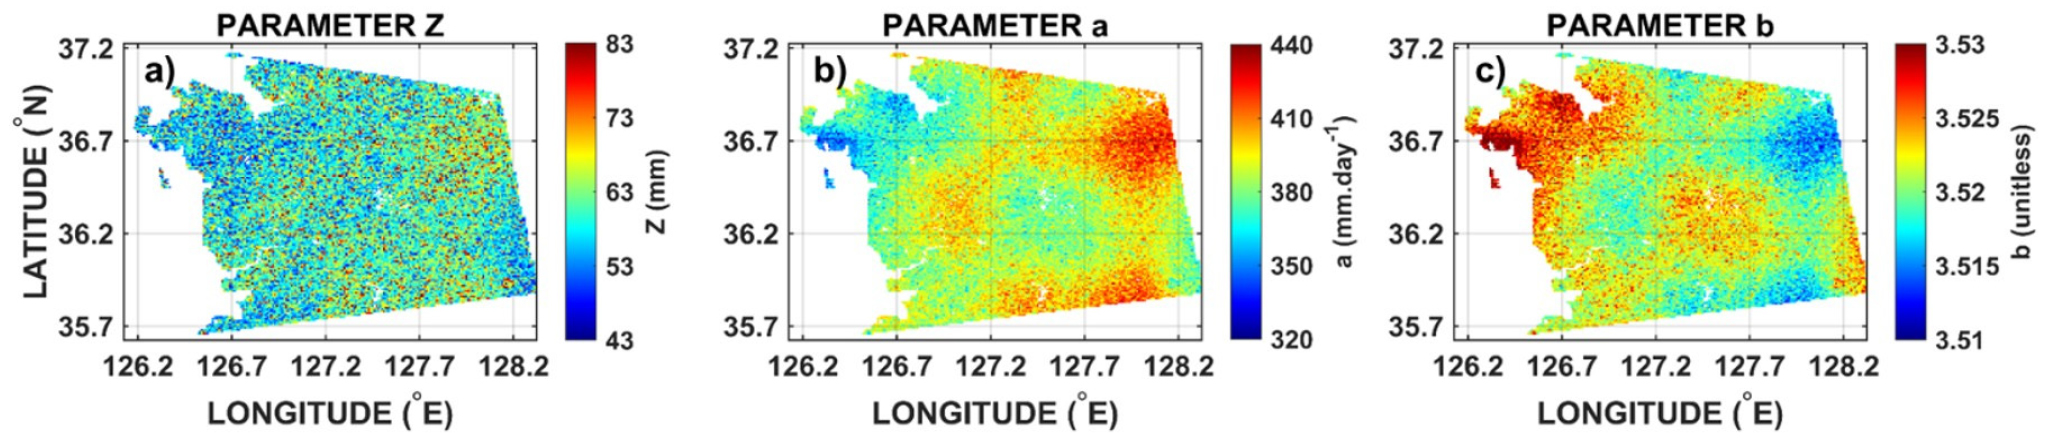
Based on the spatial maps of the land descriptors as described in Fig. 3, three parameters Z, a, and b in the SM2RAIN model can be estimated using Eq. (6). Fig. 4 shows spatial maps of these three estimated SM2RAIN parameters for Central South Korea. According to Fig. 4(a), the values of parameter Z, which indicates the soil layer depth, range from around 40 to 80 mm, and their spatial distribution is proportional to the annual average rainfall values but inversely proportional to the annual average soil moisture, with higher values observed at the mixed forests of the middle sub-region. A similar pattern was reported with the spatial map of saturated hydraulic conductivity as represented by parameter a, since its spatial distribution also correlates to the annual average rainfall, ranging from 320 to 440 mm.day-1 (Fig. 4(b)). On the contrary, the pattern of parameter b, which is an exponent controlling the drainage rate, varies around the value of 3.52 and shows an inverse correlation to those of parameter a and rainfall when higher values were observed at the west coast sub-region and lower values were distributed at the middle sub-region.
5.1.2 High-spatial resolution SM2RAIN-S1 rainfall product
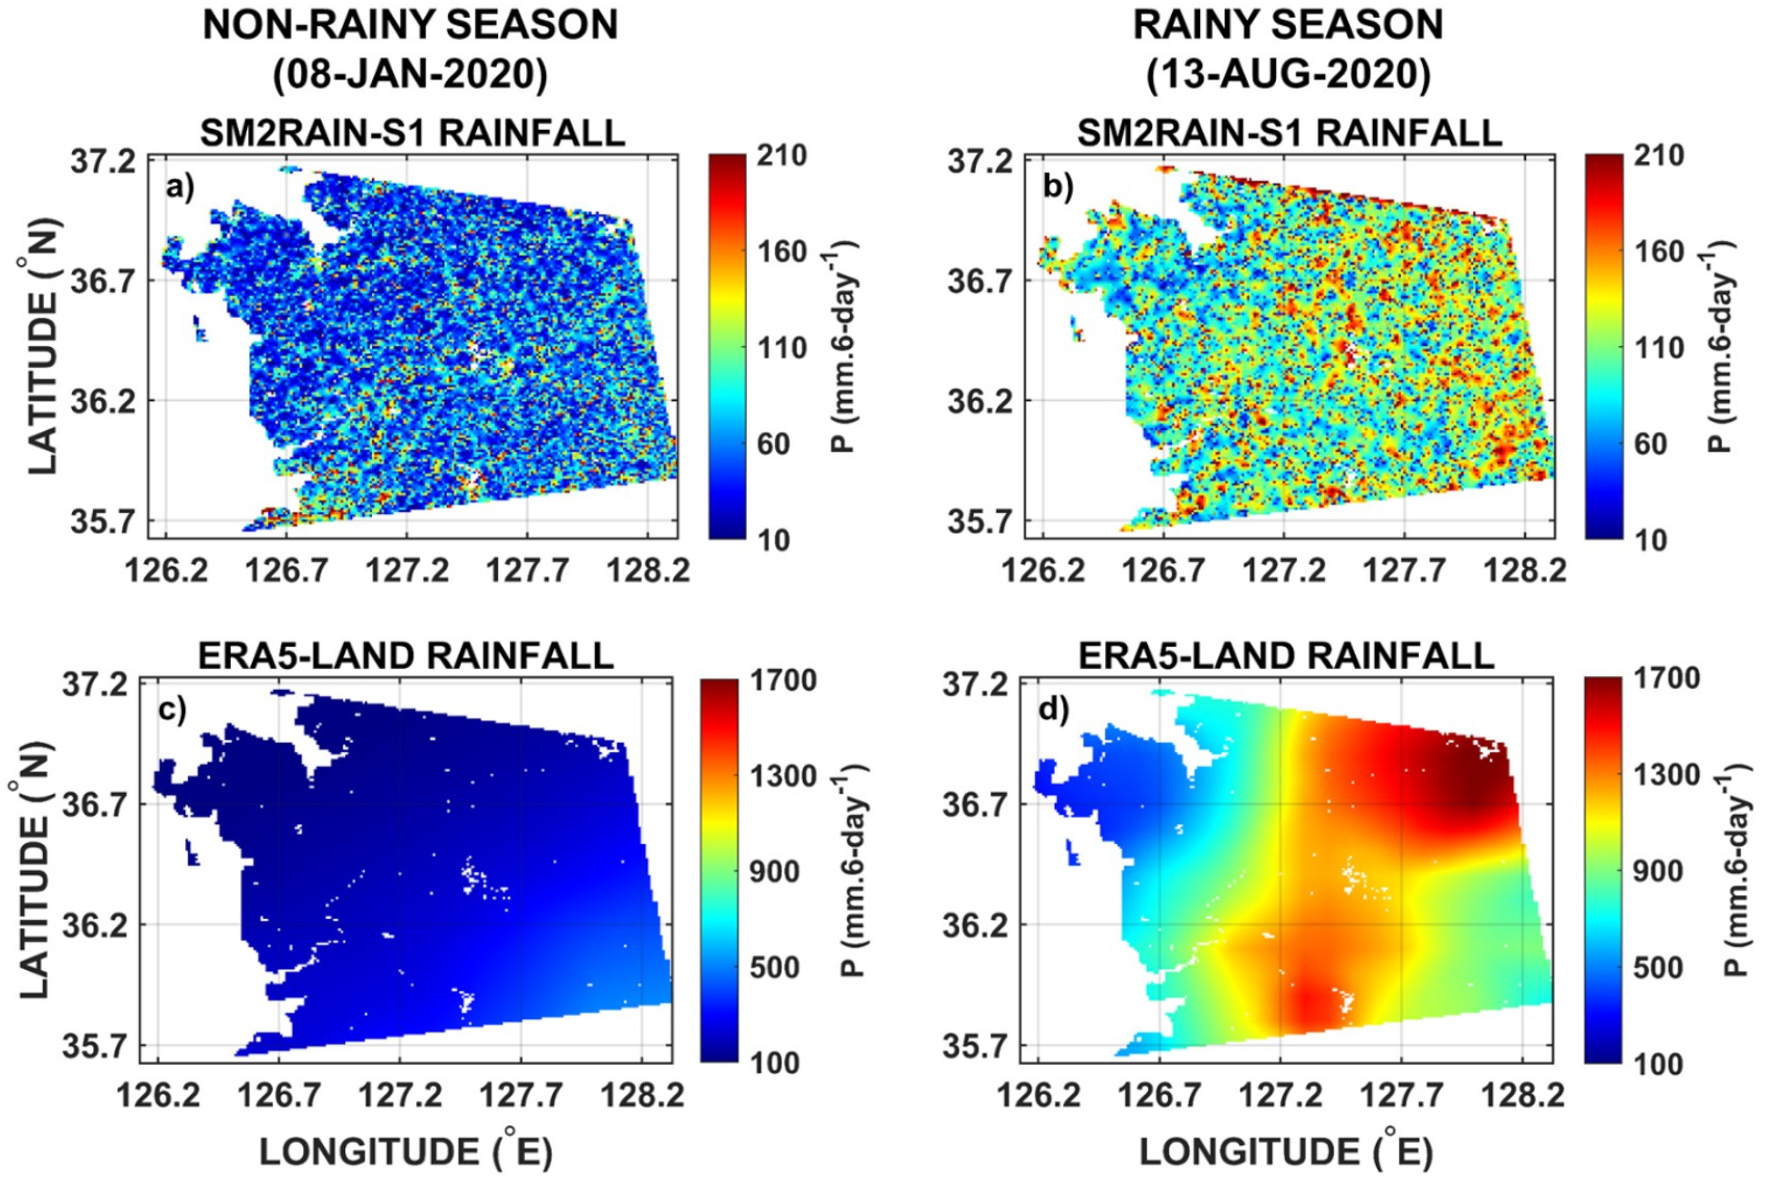
High-spatial resolution SAR S1 rainfall product (6-day 0.01° gridded SM2RAIN-S1) was then generated using the estimated SM2RAIN parameters as shown in Fig. 4. Fig. 5 provides the spatial maps of the SM2RAIN-S1 rainfall product on a day in the non-rainy season (Fig. 5(a)) and a day in the rainy season (Fig. 5(b)) in comparison with those from the downscaled ERA5-Land product (0.01° grid) at the same days (Figs. 5(c) and 5(d)). In general, a similar pattern between the SM2RAIN-S1 and ERA5-Land rainfall products was observed, with more rainfall amounts over the middle sub-region compared to those over the west coast sub-region on both days in non-rainy and rainy seasons, suggesting the potential of the SAR S1 satellites as well as the SM2RAIN application in rainfall estimation over Central South Korea. However, higher noises were observed with the SM2RAIN-S1 rainfall product on both days of non-rainy and rainy seasons as compared to the ERA5-Land rainfall product. This could be mainly attributed to the uncertainties of the SAR S1 images, since the high-spatial-resolution S1 satellites are strongly sensitive to the “wet” signal observed from other external sources (e.g., artificial water signal from irrigation, vegetation water content, or rainfall interception in vegetation…) rather than soil moisture, and the effects of these external sources are not fully eliminated during the S1 soil moisture estimation.
5.2 Evaluation of the SM2RAIN-S1 rainfall product
5.2.1 Spatial variability of SM2RAIN-S1 rainfall product
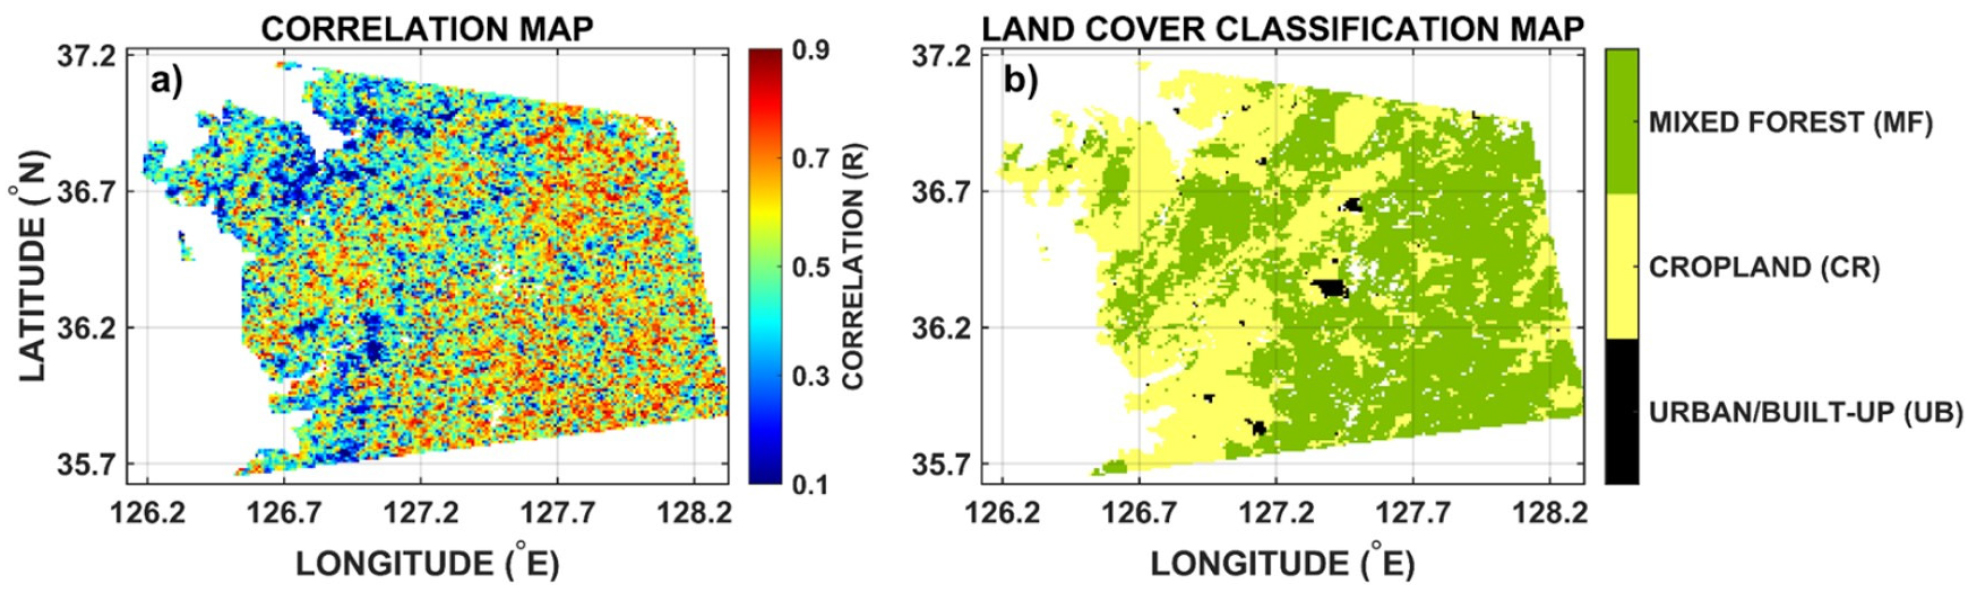
To evaluate the performance of the high-spatial-resolution (6-day/0.01° grid) SM2RAIN-S1 rainfall product regarding spatial variability, the ERA5-Land rainfall data resampled to a similar spatio-temporal resolution was selected as the benchmark product. We computed the pixel-based correlation (R) map between these two products (Fig. 6(a)) in comparison with the corresponding land cover classification map retrieved from the GCLC product (Fig. 6(b)). As can be drawn from Fig. 6 that higher R-values (~ 0.7) were mainly reported in the middle sub-region of Central South Korea where the mixed forests are dominated, while relatively lower R-values (~ 0.3) were mostly observed over the croplands on the west coast sub-region. These results imply that mixed forests and the inland climate of the middle sub-region led to lower and stable temporal variation in soil moisture and rainfall, which is more suitable with the 6-day temporal resolution of the S1 satellites, while the cropland and coastal climate of the west-coast sub-region led to higher temporal variation in soil moisture due to lower vegetation and irrigation and rainfall due to strong wind (Fang et al., 2016; Kim and Han, 2021), which may be suitable with higher temporal resolution satellite sensors. This highlights the S1 and “bottom-up” approach potential for rainfall detection in forested regions, where the traditional passive microwave satellite sensors and “top-down” approaches are restricted.
5.2.2 Temporal variability of SM2RAIN-S1 rainfall product
Ten selected KMA rain gauge stations located within the study area were employed as ground truth data for validating the temporal variability of the SM2RAIN-S1 rainfall product. Fig. 7 depicts the time series of the SM2RAIN-S1 rainfall (red line) against each of the KMA rain gauge stations (blue line) in 2020 over the two sub-regions, the middle sub-region with mixed forests (Fig. 7(a)) and the west coast sub-region with croplands (Fig. 7(b)) in Central South Korea, whereas Fig. 8 shows the scatter plots of the overall estimated rainfall (from the SM2RAIN-S1 product) against the overall observed rainfall (from the rain gauges) for each sub-region. As can be drawn from Fig. 7 that the SM2RAIN-S1 rainfall product can generally capture similar temporal dynamics and seem to be less biased as compared to those observed from rain gauges for both sub-regions. These results support the idea that the globally developed parameters of the SM2RAIN based on the ASCAT sensor are also suitable for adopting to the SAR S1 and practically applicable for satellite rainfall estimation over a local region of Central South Korea at rain gauge level. In addition, both Figs. 7 and 8 indicate that the SM2RAIN-S1 rainfall slightly overestimated the ground-truth rainfall during the non-rainy season while underestimating the ground-truth rainfall observations during the rainy season, especially over heavy rainfall events, with respect to most of the sites (e.g., STN 648 and STN 735 in middle sub-region, STN 627, STN 702, and STN 733 in west coast sub-region). These problems relate to the major limitations of the soil moisture-based rainfall estimation methods such as the SM2RAIN model where soil moisture is attributed as the major reason. In particular, soil moisture noises led to spurious rainfall events in dry conditions (overestimation in non-rainy season) while there is no soil moisture variability when it closes to saturated conditions since soil moisture cannot exceed porosity (underestimation in rainy season), being consistent with previous studies (Brocca et al., 2014, 2019; Tarpanelli et al., 2017).
The evaluation results of Figs. 7 and 8 regarding each rain gauge station and their average results for each sub-region were then summarized in Table 2 with respect to R, RMSE and Bias. As regards the comparison of the SM2RAIN-S1’s performances over two different sub-regions, R values range from 0.60 to 0.76 in the mixed forests, middle sub-region and from 0.54 to 0.61 in the croplands, west coast sub-region, with higher average R values observed in mixed forests (R = 0.69) compared to croplands (R = 0.57). This is consistent with the results shown in section 5.2.1, since the 6-day temporal resolution of the SM2RAIN-S1 product is more suitable for capturing the rainfall dynamics in forested areas rather than agricultural areas. However, when it comes to the RMSE and Bias, better performance has been reported with cropland regions rather than mixed forest areas, with lower average RMSE and Bias of 46.78 and 25.07 mm.6-day-1 over croplands compared to 50.34 and 30.86 mm.6-day-1 over mixed forests, respectively. This implies that the evapotranspiration losses within 6-day intervals significantly contributed to the errors in rainfall estimation based on the SM2RAIN algorithm when higher evapotranspiration amounts in mixed forests caused higher errors observed in this sub-region, but they were not accounted for in the SM2RAIN model due to its assumption of negligence.
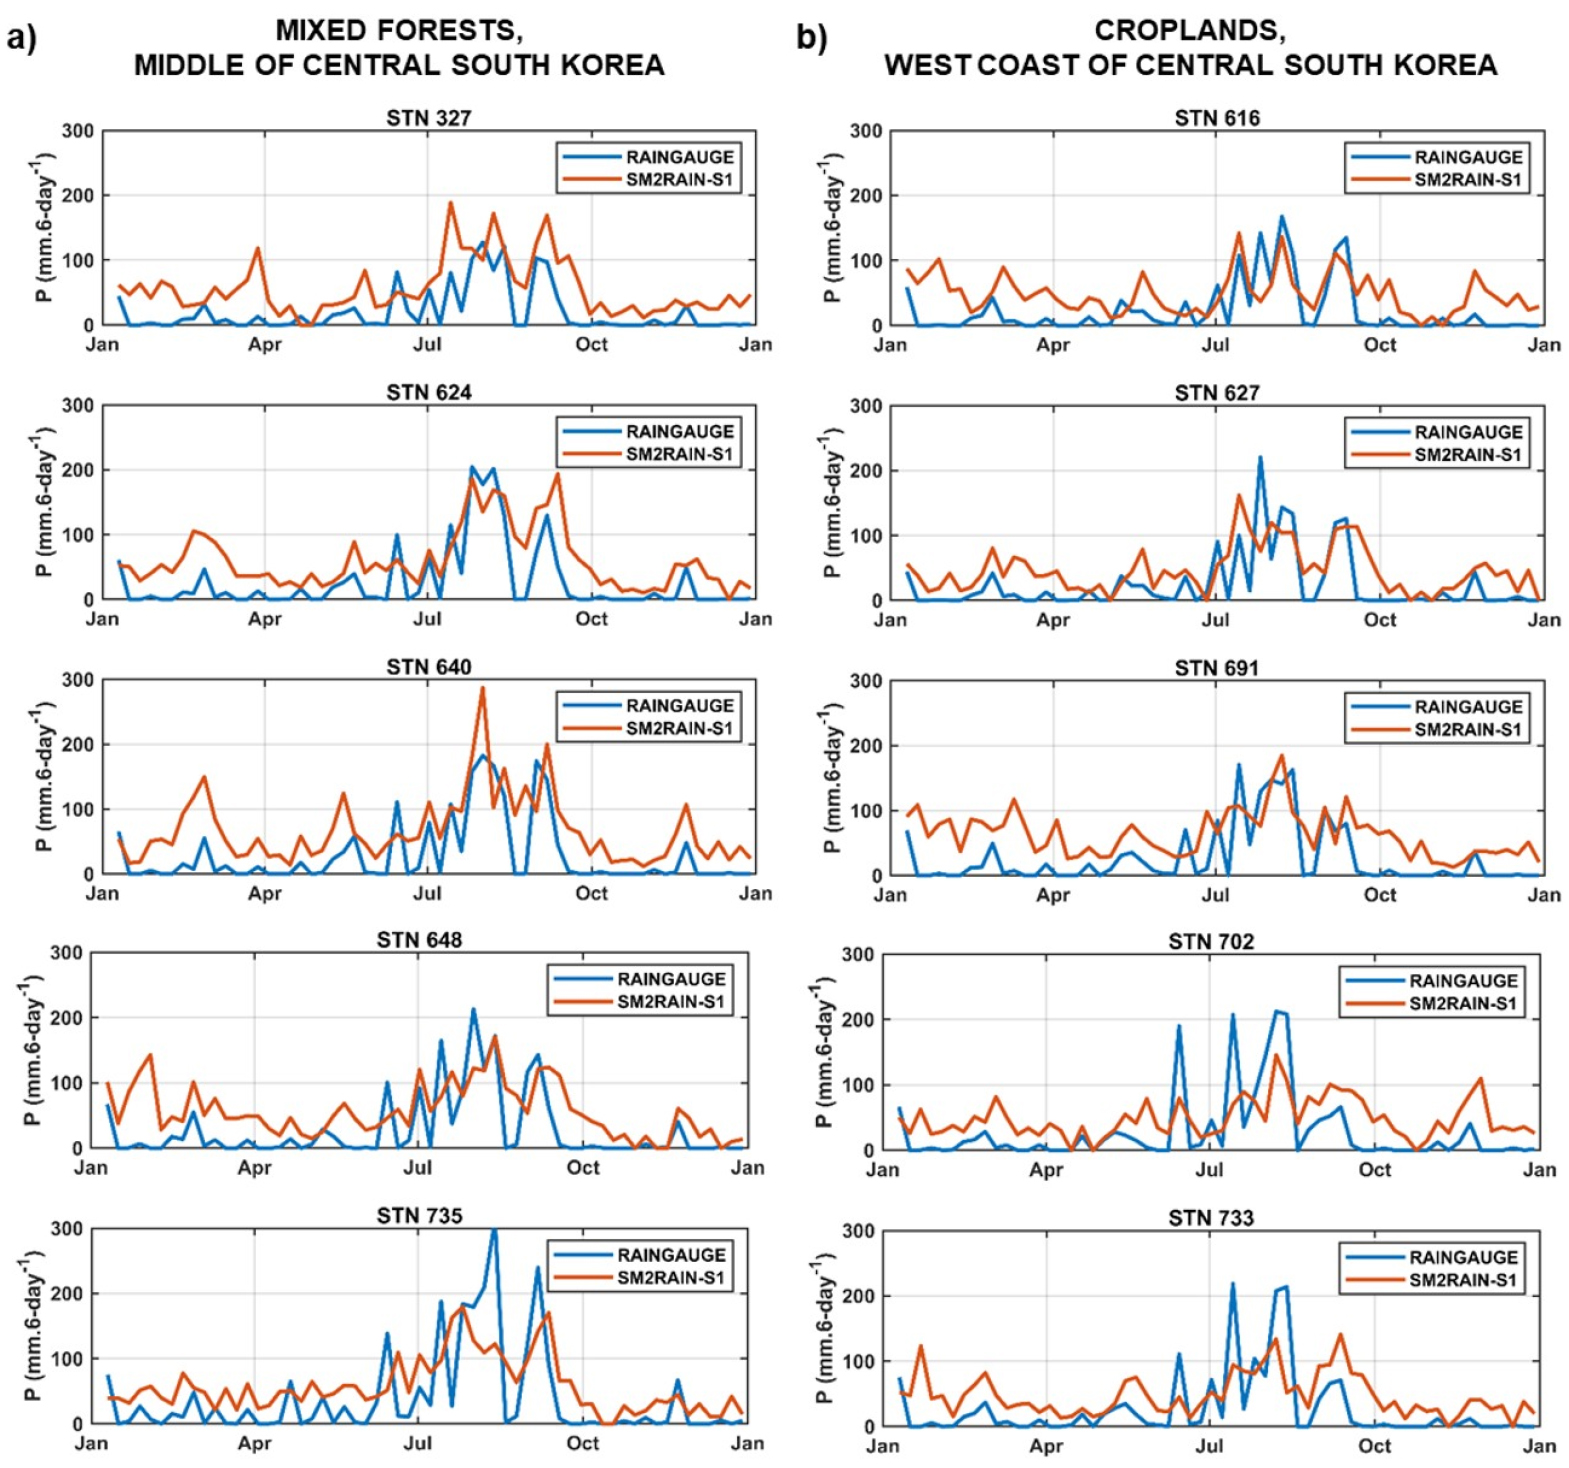
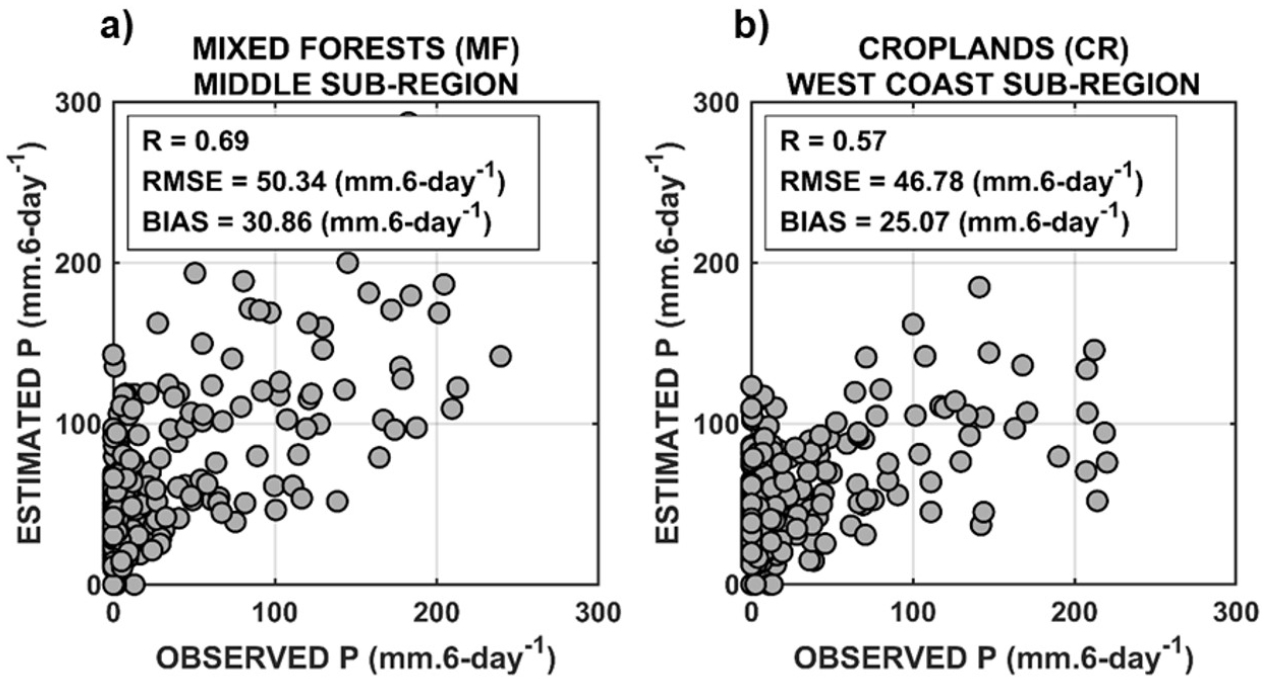
Table 2.
Evaluation results in terms of correlation R, RMSE, and Bias between the SM2RAIN-S1 rainfall product against the selected KMA rain gauge stations with respect to each station and mean values of each sub-region
6. Conclusions
This study aims to assess the potential of the “bottom-up” approach-based SM2RAIN model for generating high-spatial-resolution terrestrial rainfall estimates (at 0.01° grid) from the C-band SAR S1 satellite data (the SM2RAIN-S1 rainfall product) over Central South Korea using globally developed SM2RAIN parameters as introduced in Filippucci et al. (2021). The performance of SM2RAIN-S1 rainfall product was then evaluated for both spatial and temporal variability using the respective rainfall products from ERA5-Land and KMA rain gauges network during a 1-year period (2020) over two different sub-regions in Central South Korea-the mixed forest-dominated, middle sub-region and the cropland-dominated, west coast sub-region. Evaluation results indicated that the SM2RAIN-S1 rainfall product can capture the general rainfall pattern in Central South Korea, and holds the potential for high-spatial-resolution rainfall estimation over the local scale of different vegetation covers, with less biased estimates against rain gauge observations. Moreover, the SM2RAIN-S1 rainfall was better in mixed forests in terms of R, suggesting the suitability of 6-day SM2RAIN-S1 data in capturing the temporal dynamics of soil moisture and rainfall in mixed forests. However, the SM2RAIN-S1 product indicated a lower performance in this sub-region with respect to RMSE and Bias, implying that the higher errors caused by higher evapotranspiration losses in mixed forests were remarkable but were not accounted for in the SM2RAIN model.
Although several limitations still exist, the results of this study provide a preliminary overview of practical application for the state-of-the-art SM2RAIN-S1 rainfall product over Central South Korea, making a basis for extending this application to entire South Korea. Future studies can focus on addressing the remaining drawbacks or combining with other “top-down” SRPs for generating a complementary high spatio-temporal resolution rainfall product over the entire South Korea that can meet the demands for urban hydrology and microscale agriculture.
