

1. Introduction
2. Study Area
2.1 Data collection
3. Methodology
3.1 Mann Kendall test
3.2 Sen’s slope estimator
4. Results
4.1 Parameters trend
4.2 Mann Kendall and Sen’s slope
4.3 Impact of precipitation on EC and nitrate concentration
5. Discussion
6. Conclusion
1. Introduction
In recent decades, Earth has witnessed a growing population and increased industrialization, leading to a rapid rise in water demand. The available water resources are gradually decreasing due to the impacts of climate change and pollution. As surface water is unevenly distributed and more vulnerable to pollution, groundwater is being recognized as a crucial alternative for emergency water supply. A notable example is the case of Japan in 2011, following the earthquake, where authorities turned to groundwater as an immediate and accessible source of water, establishing temporary water supply points that often utilized groundwater for basic drinking water needs.
However, there is a growing concern about the degradation of groundwater quality, as reported by numerous studies worldwide. In South Korea, the midwestern part has reported groundwater quality degradation due to livestock and agricultural activities (Lee, 2011). Similar reports include groundwater contamination by emerging contaminants in Southwestern Ontario (Kumar et al., 2010), groundwater contamination in Slovenia (Ravbar et al., 2018), groundwater contamination by industrial pollutants in Niger (Noubactep and Caré, 2018), and groundwater contamination by pesticides in the UK (Bloomfield et al., 2006). Nitrate, not naturally present in water, its existence reflects the integration of different sources (de Ruijter et al., 2007). Groundwater pollution by nitrate is generally associated with agricultural and livestock activities, including manure, fertilizers, crops, and irrigation. Through the leaching process, the nitrogen level in water increases (Psaropoulou and Karatzas, 2014; Serio et al., 2018). Nitrate is identified as one the most widespread groundwater pollutants (Stigter et al., 2011; Green and Bekins, 2010). Intensive rainfall accelerates the nitrate concentration increase in groundwater, affecting the leaching process from agricultural areas to the groundwater system.
Electrical Conductivity (EC) is widely used as an important indicator for groundwater quality assessment (Todd and Mays, 2005). The EC of groundwater is influenced by the nature of minerals, with the presence of ions raising the EC. In South Korea, although the groundwater utilization rate is low compared to most tropical countries (Africa, South Asia, South America), it plays a crucial role as the primary source for agricultural use in rural and mountainous areas. The selected region for this study which is the Geum River Basin encompasses both urban and agricultural areas, and as of 2020, the groundwater use rate in the study area accounted for thirty-one percent of the national groundwater use (Choi et al., 2023). The Geum River Basin is one of the four major basins of South Korea, along with the Han River, Nakdong River, and Yeongsan River; it plays a crucial role in South Korea's water resources and serves various purposes (Choi et al., 2021). Anthropogenic activities and land use significantly affect groundwater quality in the basin, with many wells for groundwater pumping located near contaminant sources such as rice fields, livestock, and industrial facilities (Choi et al., 2023; 2021).
Groundwater contaminants concentration trend is important in order to take measures to reach a good chemical status, it helps water resource managers and researchers to understand the long-term pattern (Lopez et al., 2015). Various methodologies are used for trends analysis in water quality: parametric statistical tests, non-parametric statistical tests, moving average, time series decomposition, cumulative sum analysis and machine learning. The common methodology used in groundwater quality trends analysis is the application of statistical tests such as Mann Kendall test and Sen’s slope estimator (Mann, 1945; Sen, 1968; Hirsch and Slack, 1984; Jeon et al., 2020; Frollini et al., 2021). These statistical methods have not only been frequently used but have also been recently employed to analysis the trend in groundwater quality parameters in several regions such as: Italy (Frollini et al., 2021), Yazd-Ardakan Plain, Iran (Ershad et al., 2021), Seine-Normandy basin, France (Lopez et al., 2015).
For sustainable and efficient use, it is essential to understand the distribution of groundwater quality. The main objective of this study is to evaluate the temporal and spatial distribution of groundwater quality in the Geum River Basin by investigating changes in EC and nitrate concentration. The study utilizes nitrate and EC data to provide a comprehensive overview of groundwater quality in the basin from 2005 to 2021. The results of this study can be utilized by law and policy makers to formulate suitable groundwater management practices in the study basin.
2. Study Area
The Geum River Basin is located in the west-central part of the Korean peninsula, covering an average area of 9835.5 km2. It originates from Jangsu-gun, Jeollabuk-do, and extends to the West Sea through Muju, Geumsan, Yeongdong, Okcheon, Boeun, Cheongju, Daejeon, Sejong, Gongju, Cheongyang, Nonsan, Buyeo, Seocheon, and Iksan. The average annual precipitation in the study area is approximately 1323.1 mm, with an average annual temperature of about 12.2°C. Classified as a region with significant groundwater consumption, the basin has an average consumption rate of 1808 m3/day/km2.
The study area exhibits varying altitudes, with the East representing a mountainous region and a gradual decrease in altitude from East to West (Fig. 1). Land use is diverse, with 60% covered by forests and agricultural areas accounting for 18%. Forest covers in each district range from 33% to 83%, while agricultural lands occupy 4.6% to 52% of sub-basin areas. Sub-basins with larger agricultural lands tend to have smaller forest covers. Urban areas make up 5.3% of the total river basin, as reported by the Korea Forest Service (http://forest.go.kr).
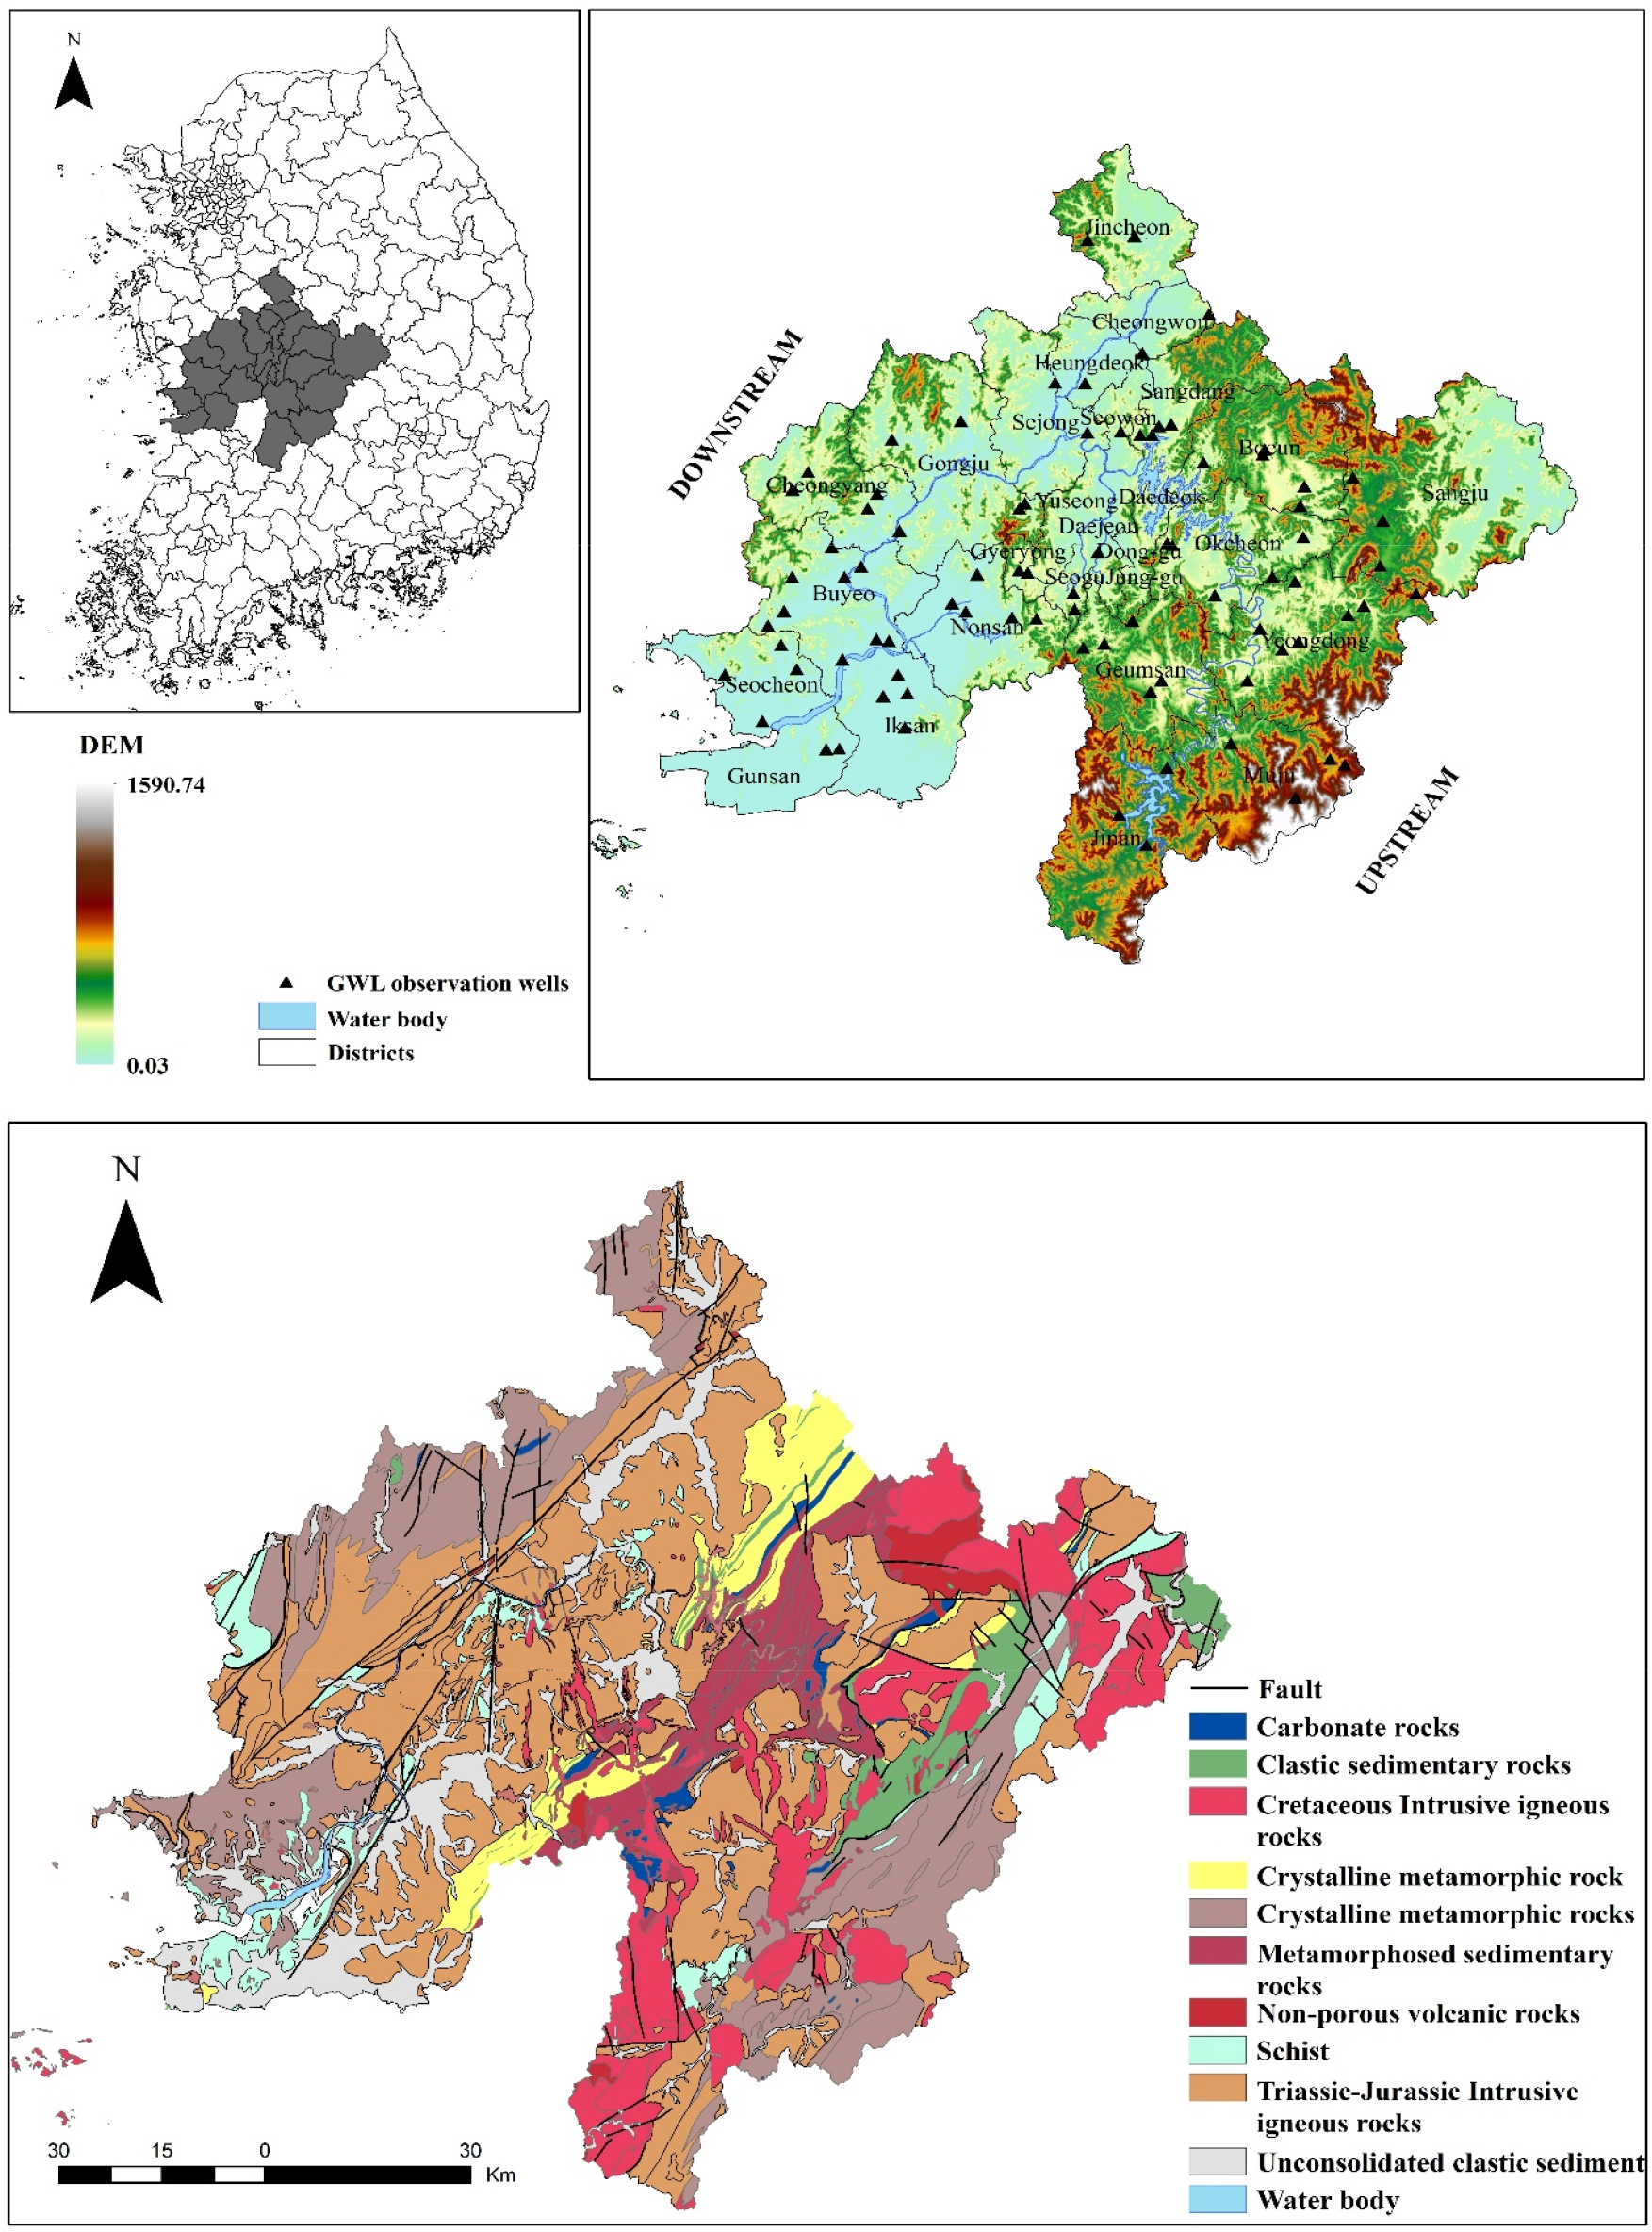
The geological composition of the Geum River Basin primarily includes Precambrian gneiss and Jurassic granite in the central region (Fig. 1). Additionally, Quaternary alluvial deposits are widespread along major rivers within the basin. These alluvial deposits exhibit high permeability and substantial groundwater yield, reaching up to 800 m3/day (Lee et al., 2019). The alluvial aquifers consist of unconsolidated sediments and are distributed extensively throughout the Geum River Basin (Fig. 1). The study area has an important reserve of surface water and groundwater, but these resources are threatened by the industrialization and population growth which potentially count for the choice of this study.
2.1 Data collection
For the purpose of this study, times series data of groundwater contaminants (EC, nitrate concentration) was collected. EC and Groundwater Level (GWL) data spanning a 17-year period from 2005 to 2021 were acquired from the Korean National Groundwater Information Center (https://www. gims.go.kr, visited on 05/15/2023) across the study region. Following meticulous data analysis, a total of 49 wells, devoid of any missing data, were ultimately incorporated into the study. Simultaneously, daily precipitation data for the corresponding timeframe was gathered from weather stations situated in the Geum River Basin.
Nitrate concentration data within the study area were systematically monitored in select wells by the Korean National Groundwater Information Center. Sampling for analysis occurred biannually, resulting in a comprehensive dataset sourced from reports and water quality reports spanning a six-year duration, from 2015 to 2020. After collecting all the data, based on the geographic location of the observation wells, the arithmetic mean was calculated for the districts in the study region and used for the study.
3. Methodology
The present study applied the Mann Kendall test to study the long-term trend of each parameter and the Sen’s slope to evaluate the magnitude of the trend. These two statistical methods are chosen because of their robustness, ease application, versatility and ability to provide meaningful results even with limited data; they have been widely used by many researches to assess trends in water quality parameters in both groundwater (Jeon et al., 2020; Frollini et al., 2021; Lee et al., 2019; Mendizabal et al., 2012) and surface water (Groppo et al., 2008). Both methods are widely used due to their sensitivity to change in dataset; they help to identify variations and shifts in groundwater quality trends. This sensitivity is important to identify alterations in water quality trends.
3.1 Mann Kendall test
The Mann-Kendall trend test is a nonparametric statistical test used to assess trends in time series data (Mann, 1945). It was first developed and used to describe meteorological data (Oñate and Pou, 1996). It provides a robust method for detecting monotonic trends without making strong assumptions about the underlying distribution of the data. The methodology is based on statistics S, which can be calculated as follow (Mahanta et al., 2022):
where Xi and Xj are the values of sequence i, j; n is the length of the time series and sgn is calculated as below:
The standardized test statistic Z is calculated by:
The standardized Mann Kendall statistic Z follows the standard normal distribution with E(Z) = 0, and the null hypothesis is rejected if the absolute value of Z is larger than the theoretical value Z1−α/2 (for two-tailed test) or Z1−α (for one-tailed test), where α is the statistical significance level concerned. The value of α is chosen based on the specific requirements of the study, which is the consequences of making a type of error, and the desire to control the overall level of significance in the statistical analysis.
3.2 Sen’s slope estimator
Sen initially developed this test to assess statistical linear relationships, as outlined by Agarwal et al. (2021). It serves the purpose of quantifying trends in long-term temporal data (Agarwal et al., 2021). Sen's slope is particularly favored for detecting linear relationships due to its resilience against the influence of outliers in the dataset (Ducci et al., 2019). In this study, we apply Sen's slope to determine the magnitude of the trend in each parameter. The slope (Ti) of all data pairs is first calculated:
for i = 1, 2,…N
xj and xk, are data values at each time. The median of these N values of Ti is Sen’s estimator of slope. It is calculated using following formula:
After analyzing the trend in groundwater quality, the correlation between quantitative parameters and qualitative parameters was calculated using Pearson’s correlation coefficient to evaluate the potential impact of precipitation and GWL on the qualitative parameters. The correlation is calculated using the following equation:
Where xi, yi are the data point and are the mean of x values and y values, respectively.
4. Results
4.1 Parameters trend
The study assesses the trend of various parameters, including precipitation, groundwater level, electrical conductivity, and nitrate concentration in groundwater, for each district throughout the study period. The analysis reveals statistical fluctuations in both increase and decrease of these parameters.
Fig. 2 illustrates the average annual precipitation data for all districts within the study area from 2005 to 2021. The district’s mean is calculated by generating the arithmetic mean of rainfall gauge stations per district. Among the districts, Cheongju (청주) stands out with the highest recorded average annual precipitation, while Yuseong (유성) holds the lowest, with mean values of 1,350 mm and 860 mm, respectively. Fig. 2 visually represents a significant volatility, depicting an order of magnitude of 1,000 mm between the minimum and maximum annual precipitation in some districts across the Geum River Basin during the study period.
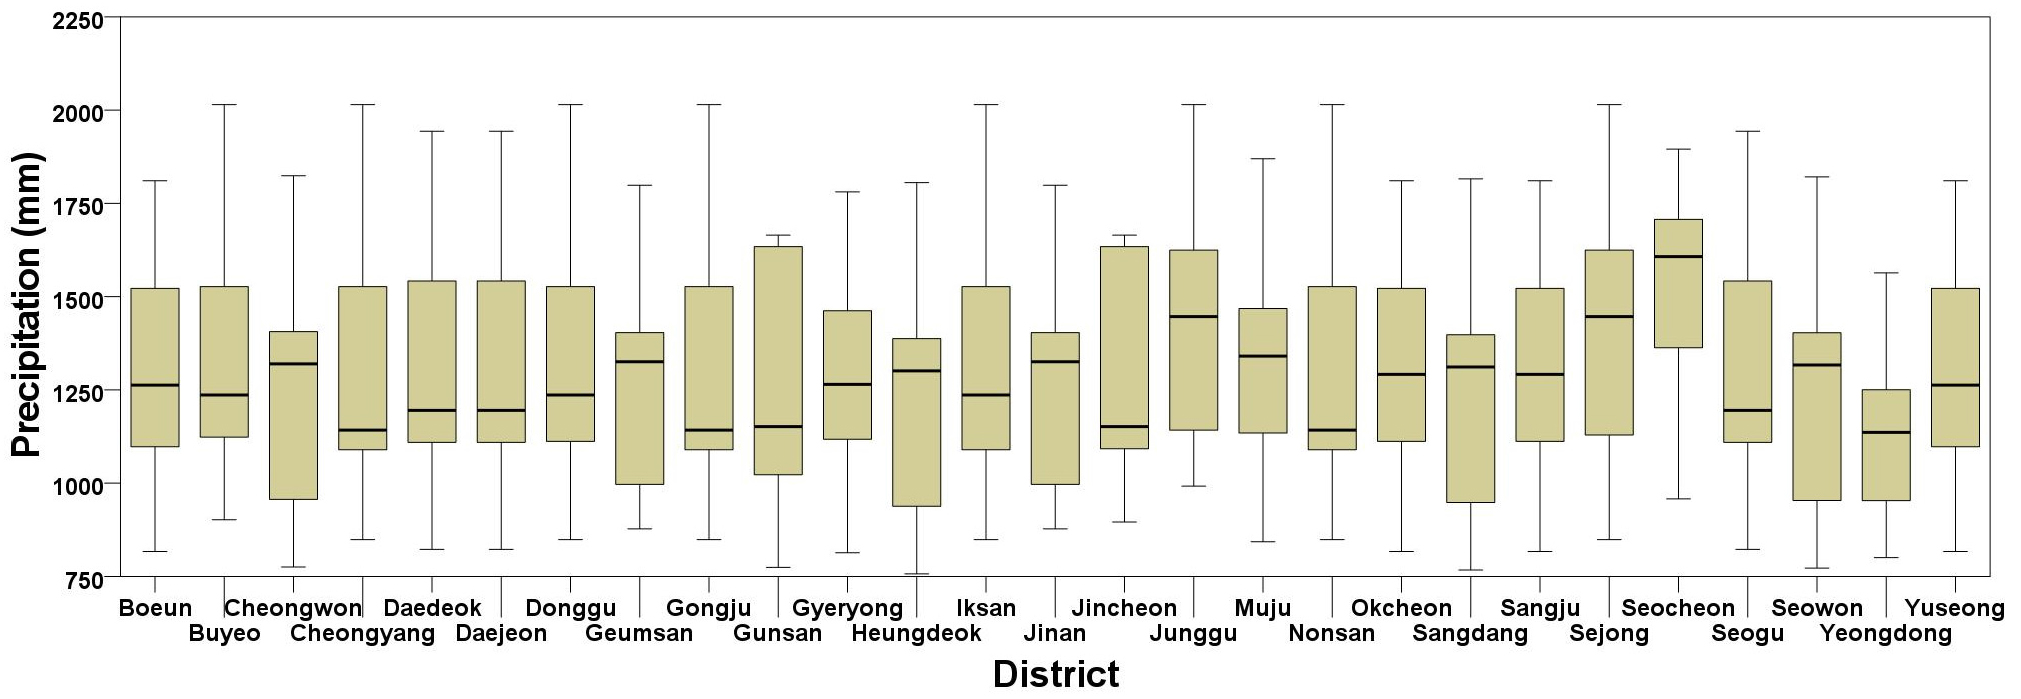
Fig. 3 illustrates the changes in GWL from 2005 to 2021 within the study area. The GWL values per district exhibit relatively low dynamics, evident from the subtle shadows on the candle bars in Fig. 3. These shadows represent the variations between the minimum, mean, and maximum values. The average GWL per district spans a range of 0.33 m to 272.31 m.
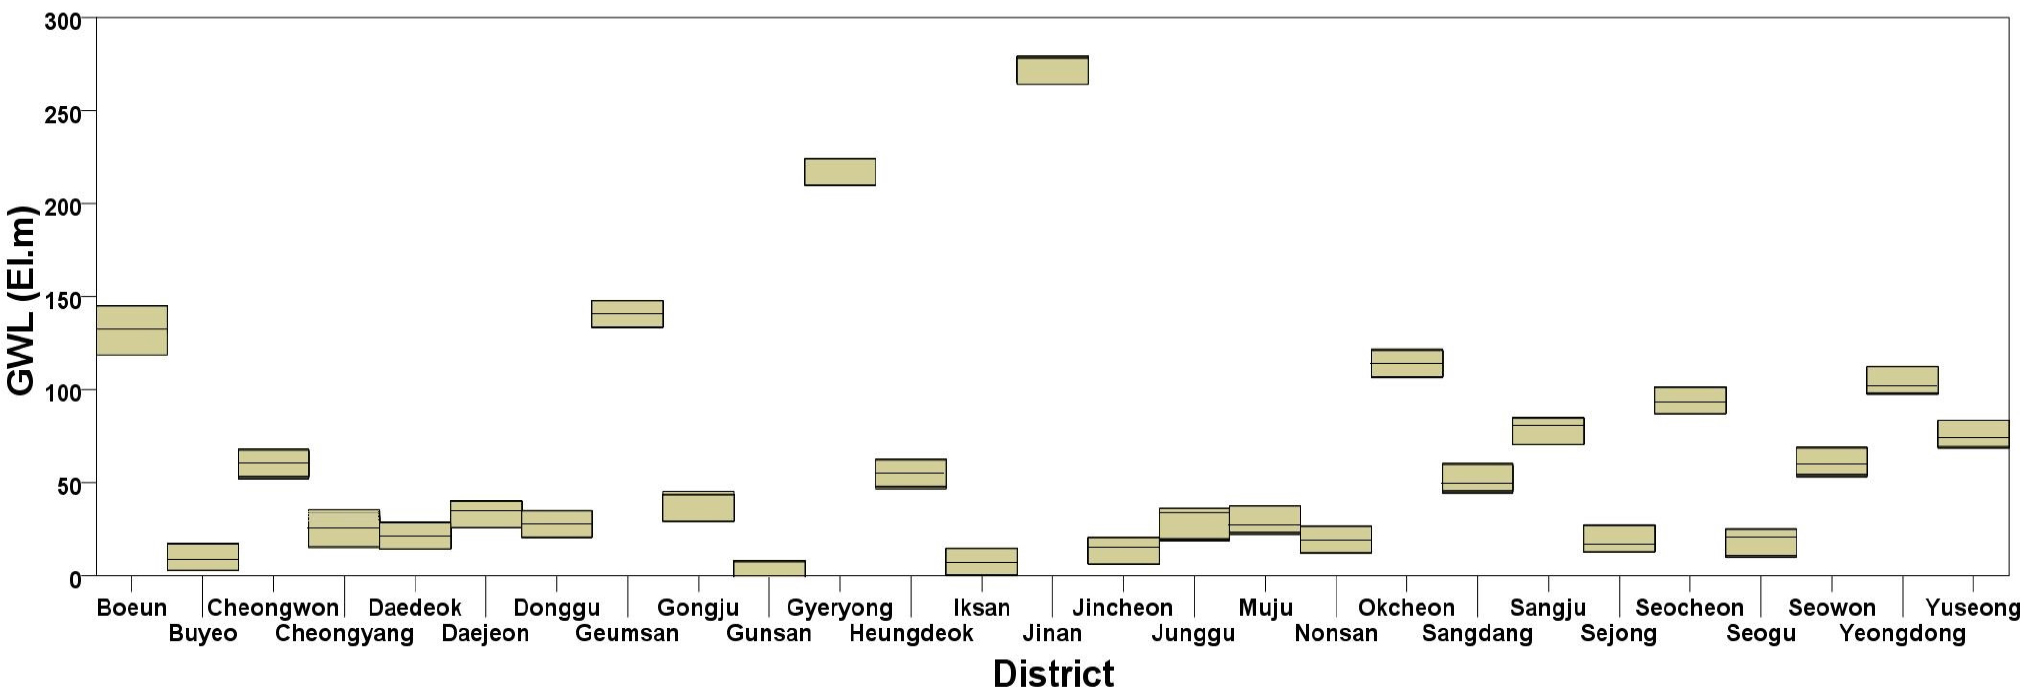
Jinan (진안) records the highest GWL value, while Gunsan (군산) has the lowest. Notably, wells with elevated GWL are predominantly situated in the upstream and midstream portions of the basin. Over the study period, certain regions, such as Cheongyang and Nonsan, witnessed a decrease in the mean GWL within the study area. Conversely, in other regions, such as Cheongju and Cheonan, there was an observed increase in GWL mean.
The daily EC data depicted in Fig. 4 were collected and analyzed from the observed wells. Over the period from 2005 to 2021, the EC values exhibit a random distribution within the study area. The average annual EC spans a range between 57.42 and 1404.36 µS/cm, as illustrated in
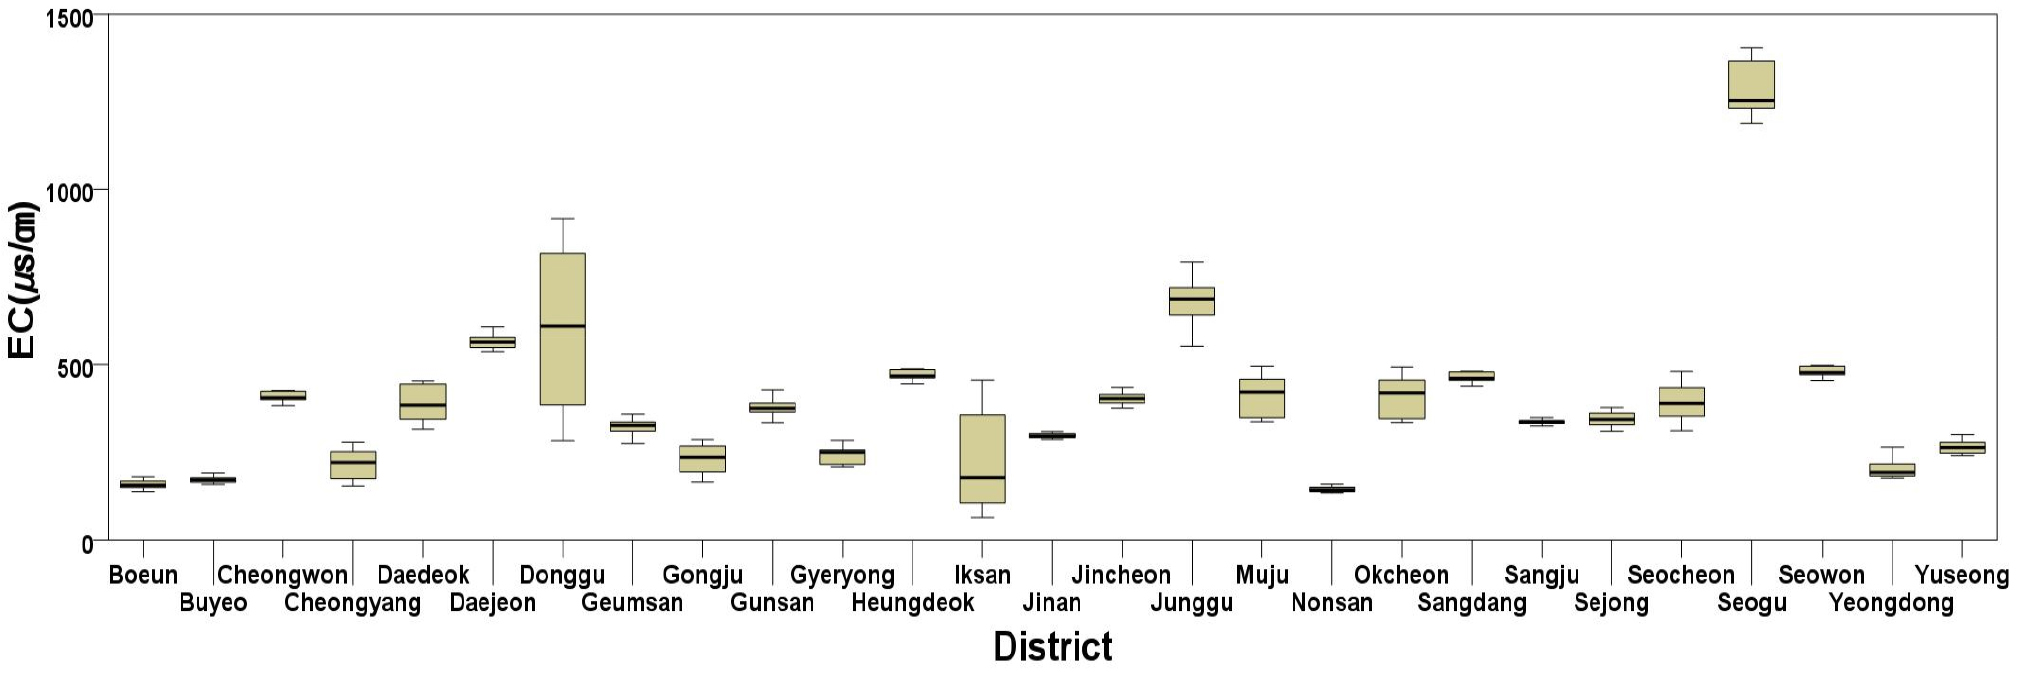
Fig. 4. The maximum EC value recorded across the study area falls within the typical range for freshwater (typically between 0 and 1500 µS/cm). The highest EC values are predominantly observed in the midstream and downstream regions. Many of these elevated values display dynamic fluctuations, experiencing yearly changes on the order of 100 to 200 µS/cm in some districts.
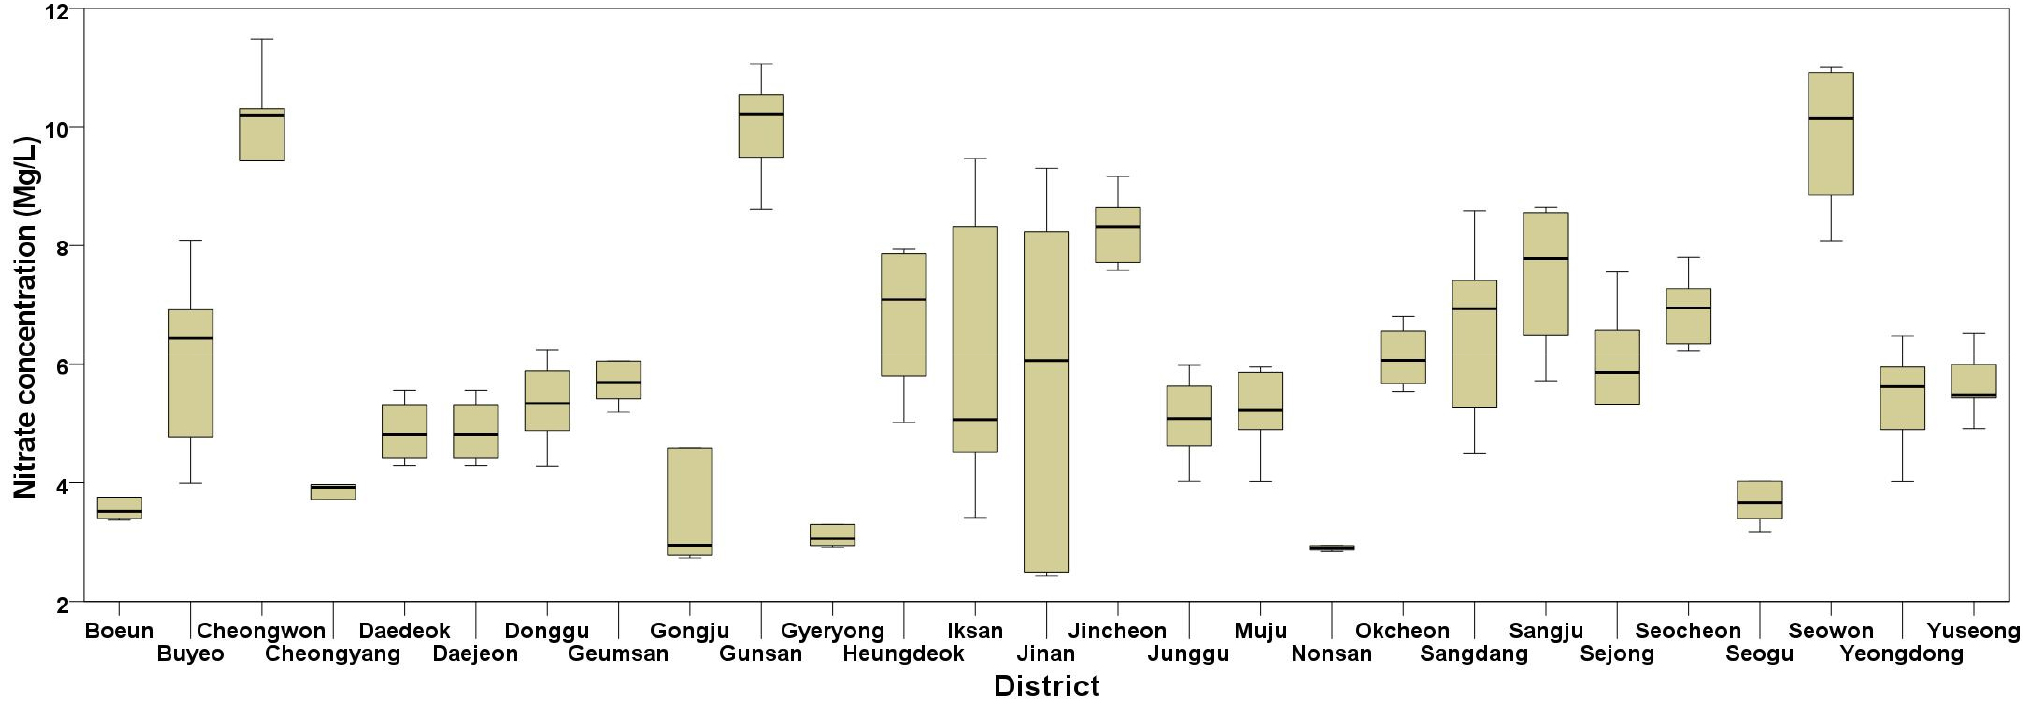
The last parameter studied is the nitrate concentration in groundwater. The nitrate concentration data available from 2015 to 2020 was collected and the average annual values are ranged between 0.27 and 17.82 mg/L. This study didn’t conduct a groundwater sampling to analyze the nitrate concentration, only the few available ones were collected, therefore, only the trend in the data was studied and not the mean by district area.
4.2 Mann Kendall and Sen’s slope
The Mann-Kendall test and Sen's slope, as previously introduced in the methodology, were employed to analyze the trend and trend’s magnitude of each parameter for groundwater quality trend analysis in the study region. According to the results, precipitation has slightly decreased in certain regions, while others have exhibited an increasing trend. Notably, the district of Sejong (세종) recorded the highest decrease in precipitation, approximately 32.98 mm from 2005 to 2021, while Sangju (상주) registered the highest increase at about 10.25mm. Generally, precipitation has shown an upward trend in upstream districts situated in mountainous areas with high forest density.
Before examining the change in groundwater quality in the Geum River Basin from 2005 to 2021, the variation in GWL was first assessed. The changes in precipitation and groundwater level are assessed in this study to show a general overview of quantitative parameters which could affect the qualitative parameters; and worth noting that the qualitative aspect is the focus in this study. The calculated GWL trends indicate a decline in most districts. The Sen's slope estimator identified the highest GWL decline from 2005 to 2021 in the district of Muju (무주), followed by Jincheon (진천), Iksan (익산), and Sangju (상주) with decreasing values of 0.36m, 0.29 m, 0.26 m, and 0.22 m, respectively. Conversely, during the same period, GWL increased in districts such as Cheongyang (청양) with an average value of 0.35 m, Gongju (공주) with an average value of 0.02 m, and Cheongju (청주) with an average value of 0.07 m. Fig. 5 illustrates the GWL slope per district from 2005 to 2021, showcasing a decline across the area, particularly emphasized in the upstream and midstream rather than the downstream regions.
To assess groundwater quality trend over time in the Geum River Basin, two parameters were considered: EC and nitrate concentration in groundwater. These two parameters were considered as they were the most available and due to their importance in groundwater quality analysis. Nitrate holds an importance in groundwater quality, it is considered as an important groundwater pollution indicator due to its mobility and potential to migrate through soil into groundwater (Przydatek and Kanownik, 2021). EC is important key in groundwater quality because it provides information about the dissolved ions in the water; it changes indicate an introduction from a different source from the effect of anthropogenic activities such as industrial pollutants or agricultural runoff, that contribute to the ion concentration in groundwater (Tutmez et al., 2006). The Mann-Kendall analysis for EC revealed predominantly positive values across most districts, indicating an increase from 2005 to 2021. About twenty-three districts out of all the twenty-seven showed positive values for the Mann Kendal test in the study period (results showed in Table 1). The calculated p-values (Table 1), showed that the EC increasing trend observed is not monotonic in all the district, the case of muju. Most significant trends are observed in eleven districts. The trends magnitude in each district was evaluated using the Sen’s slope estimator. Within the study area, the trend calculated for the study period are ranged from -4.437 µS/cm to 23.258 µS/cm. The highest increase slope was observed in the districts of Iksan, Seocheon and Jung-gu, with average values of 23.25 µS/cm, 12.89 µS/cm, and 12.71 µS/cm, respectively (Table 1 and Fig. 6). The decreasing trend recorded in a few districts (Seowon, Sangju, Cheongyang, and Boeun) was deemed insignificant. The EC trend in districts tends to increase from upstream to downstream.
Table 1.
Mann Kendall and Sen's slope results
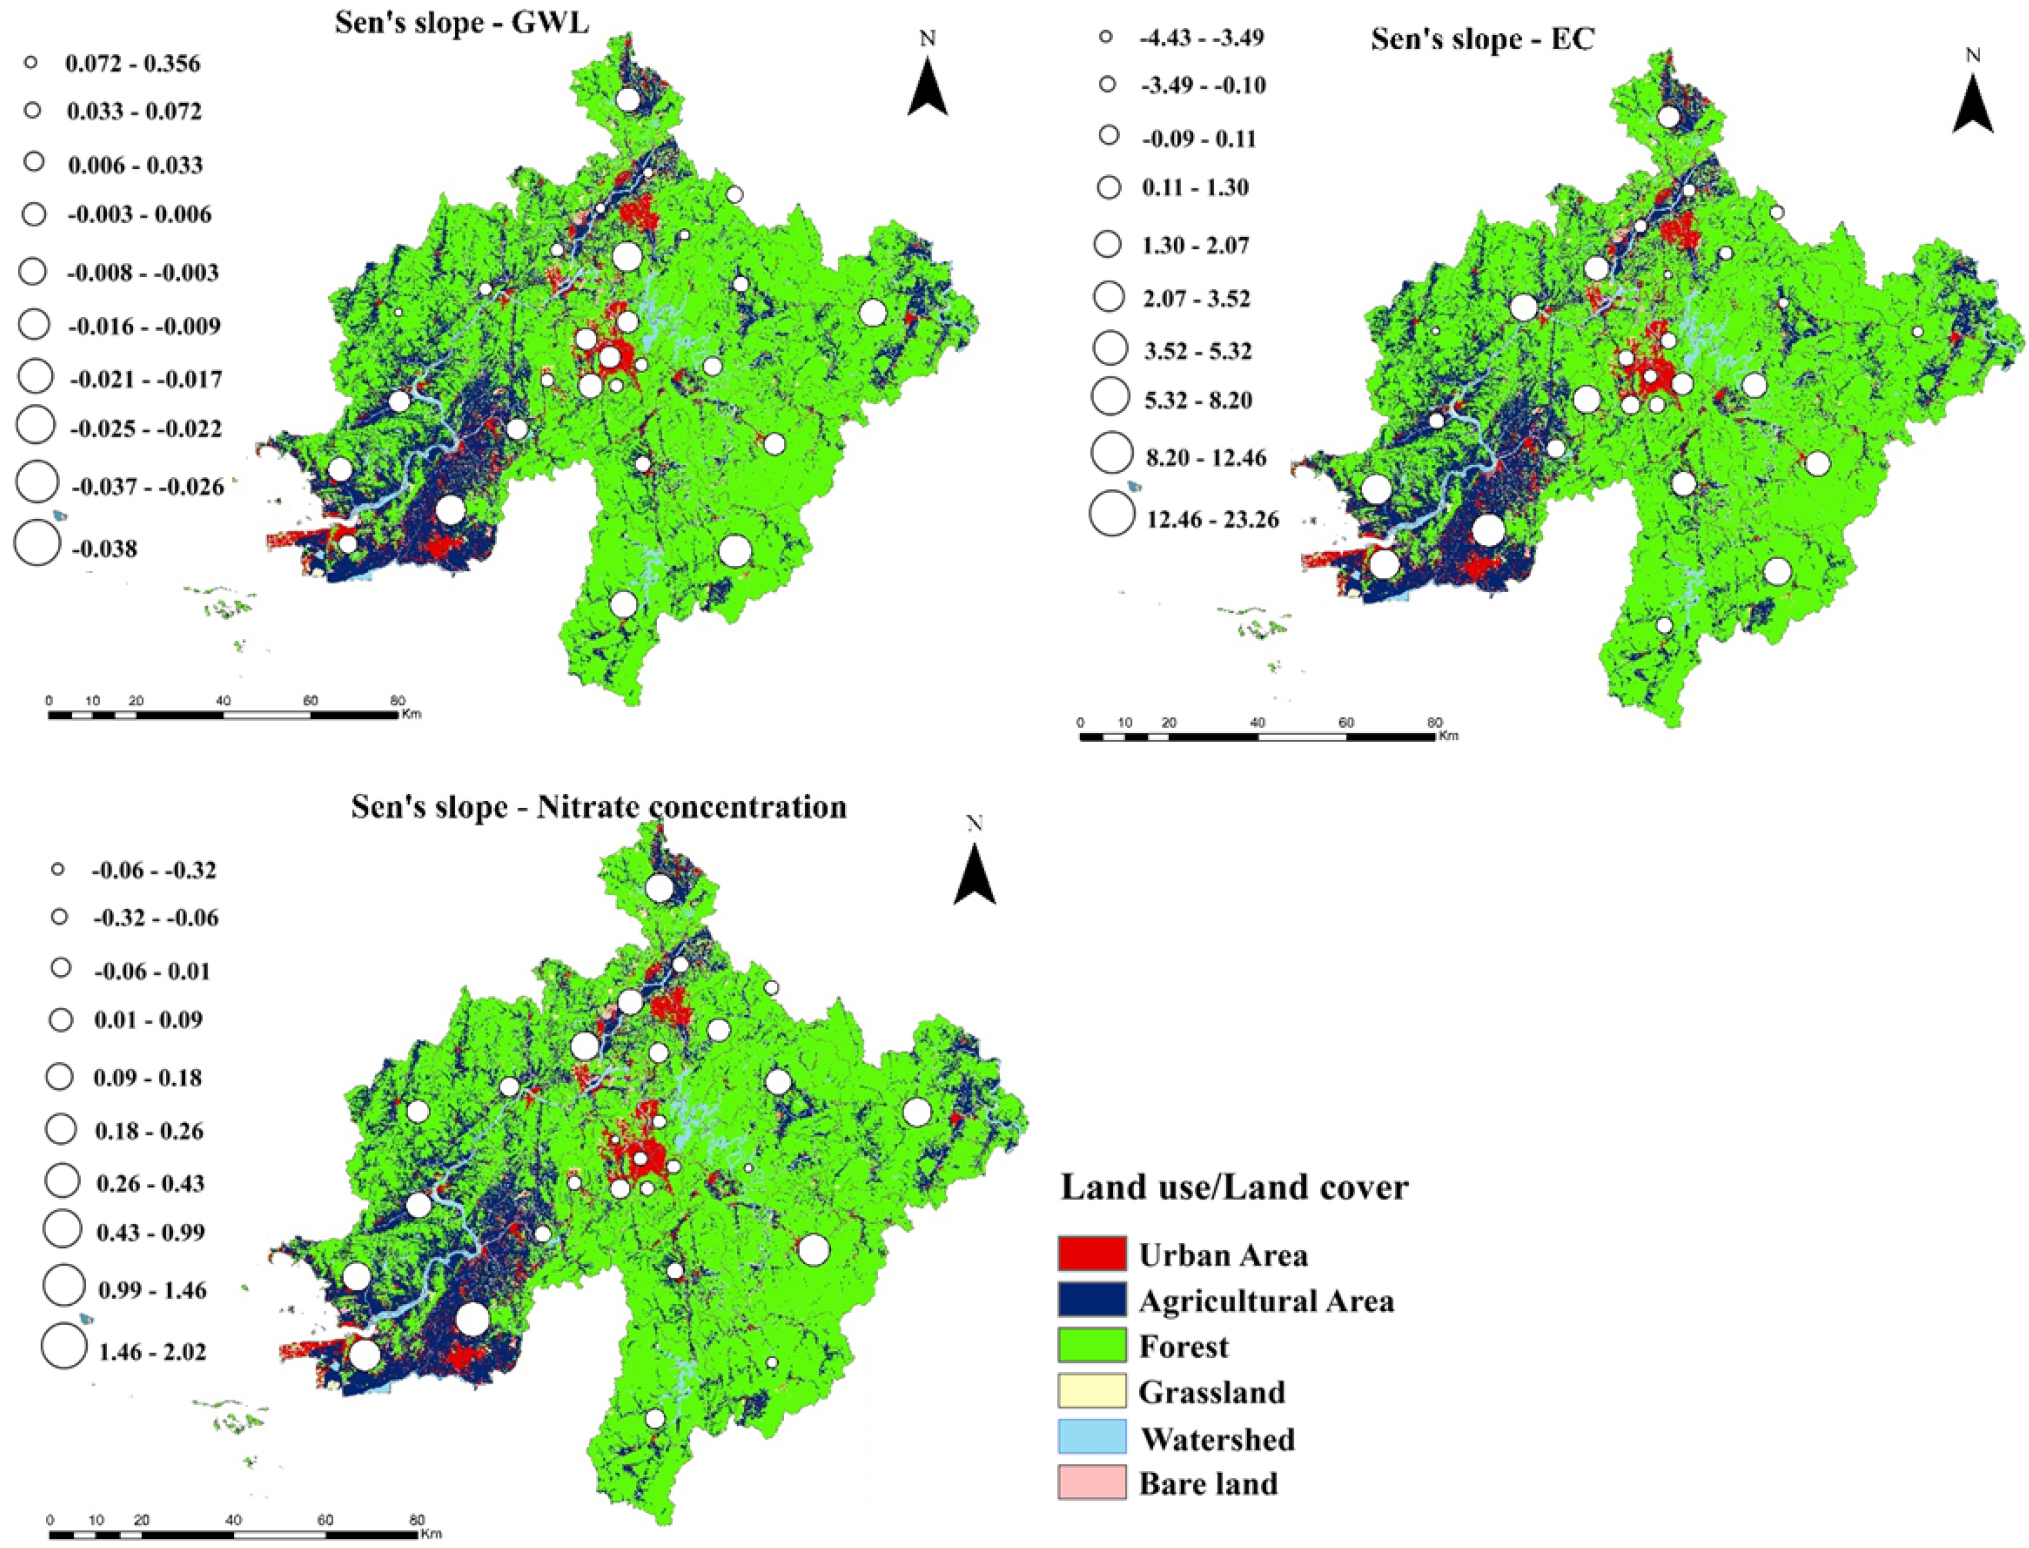
Analyzing the average annual nitrate concentration in groundwater from 2015 to 2020 using the Mann-Kendall test showed an increasing trend in more than half of the districts in the studied basin. The Mann Kendall test showed positive values in about eighteen districts with a p-value less than 0.05 in six districts. Both increasing and decreasing trends are monotonic in few districts. Significant trend in nitrate concentration is observed in two districts. Using the Sen’s slope estimator described previously, the trend magnitude in each district was estimated. The highest increase slope was observed in Iksan with a value of 2.02 mg/L, and the second-highest value of 1.16mg/L was recorded in Gunsan (Table 1). Conversely, nitrate concentration decreased in some regions during the same period, notably in Dong-gu (동구) with a decline value of 0.33 mg/L (Table 1).
4.3 Impact of precipitation on EC and nitrate concentration
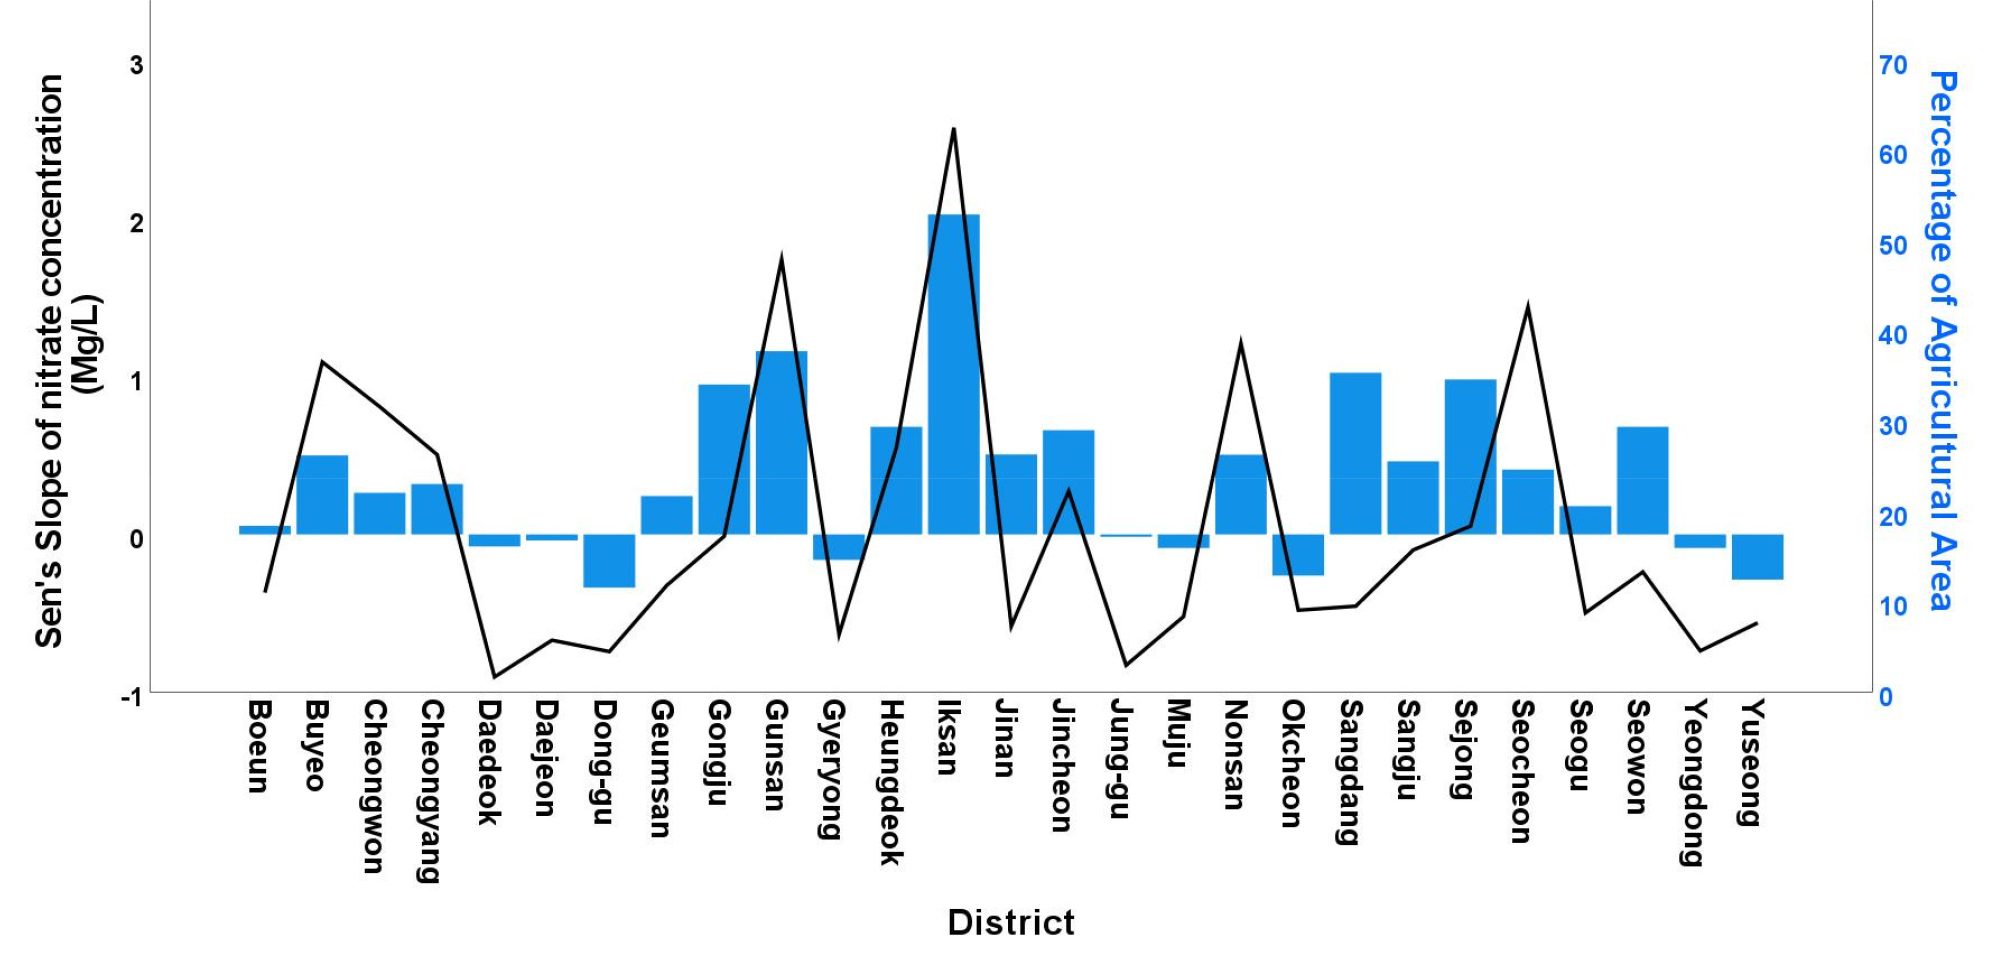
The assessment of the impact of precipitation on nitrate concentration and EC within the study area involves calculating the correlation between these parameters, as illustrated in Fig. 7. Due to the relatively short time period for nitrate concentration data, Sen's slope values were employed for a spatial comparison, particularly with respect to land use, primarily focusing on agricultural land. The percentage of agricultural land area was determined by calculating the ratio of agricultural area to district area, and the results are depicted in Fig. 8.
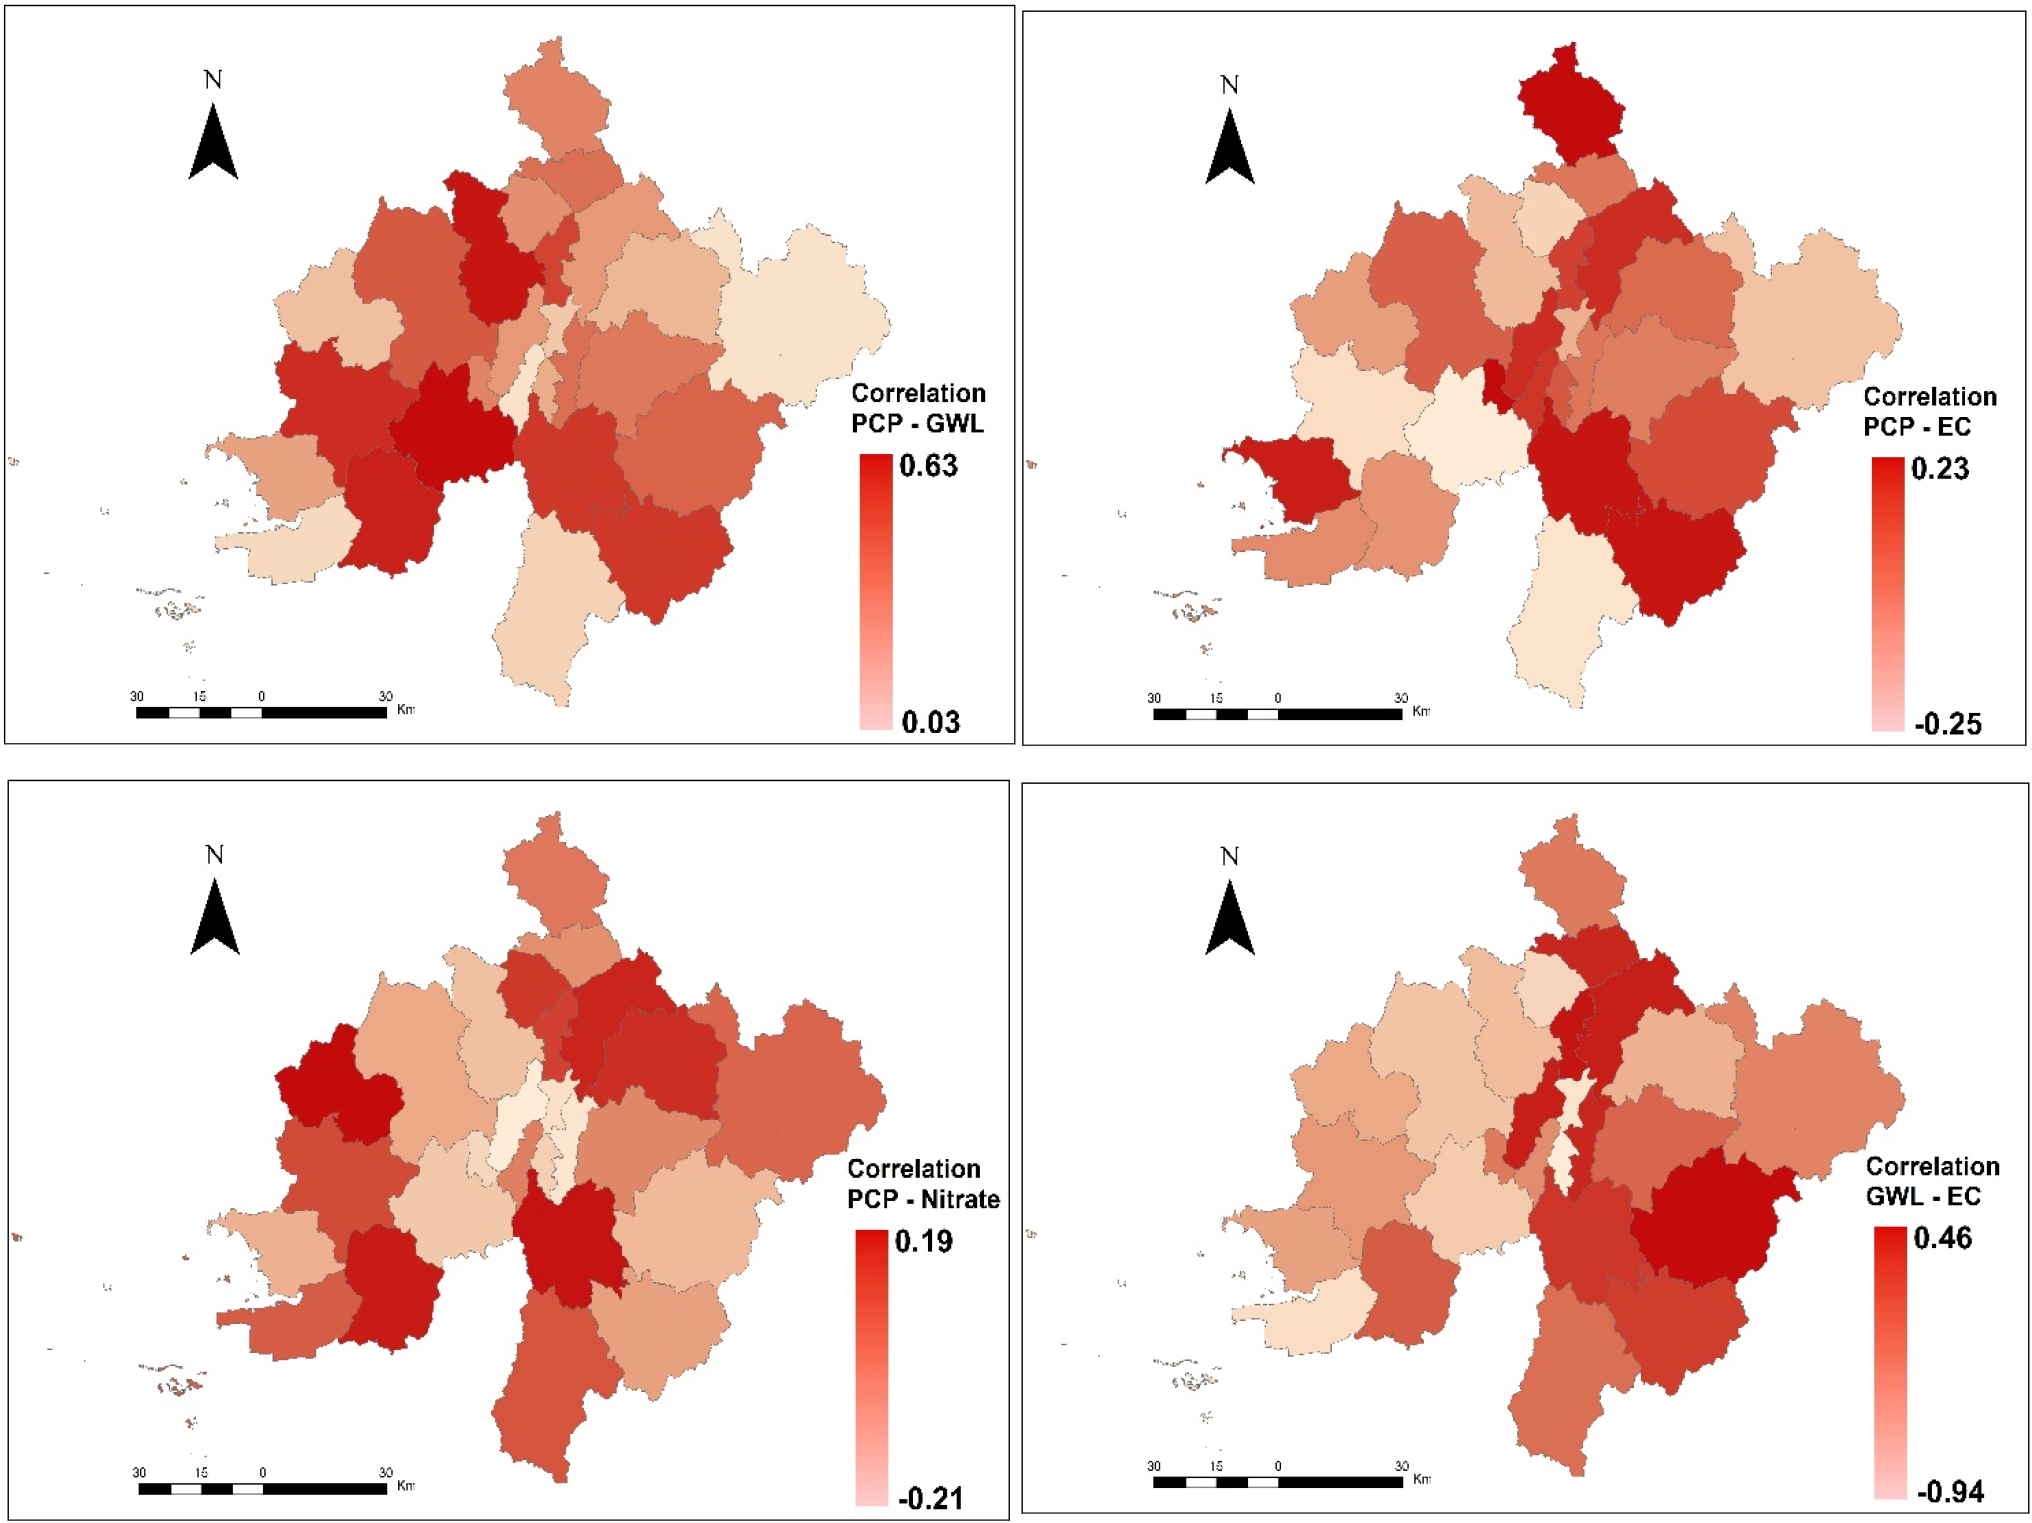
Pearson's correlation calculated between various parameters indicates that there is no direct correlation between precipitation and EC or nitrate concentration, utilizing six years of data from 2015 to 2020. The correlation values between precipitation and EC range from -0.25 to 0.23, while the correlation between precipitation and nitrate ranges from -0.21 to 0.19. The correlation observed between precipitation and groundwater quality parameters (nitrate concentration and EC) is so low showing that the direct effect of precipitation on these parameters is insignificant.
To provide a more comprehensive interpretation of the correlation between precipitation and EC or nitrate, the impact of precipitation on GWL was also assessed by calculating the correlation between PCP and GWL. The correlation between these two parameters is generally low, ranging from 0.01 to 0.63, with an average value of 0.19. The consistently low correlation values suggest that direct groundwater recharge from precipitation is minimal in the study region. This limited infiltration from direct precipitation implies a robust interaction between groundwater and surface water in the basin. This made believe that groundwater quality in the region might be strongly influenced by the surface water quality in the study region. The correlation between GWL and EC spans from -0.94 to 0.46, the negative correlation between both parameters was observed in many districts. This is because of dilution while GWL level increases, the conductance decreases.
The correlation between the spatial distribution of nitrate concentration and land use, particularly agricultural land, was examined by calculating the percentage of agricultural area in each district and comparing it with the Sen's slope of nitrate concentration. The graphical representation of the nitrate concentration slope and the percentage of agricultural area is depicted in Fig. 8.
As observed in the graph, the nitrate concentration slope and the percentage of agricultural area exhibit similar trends in numerous districts. Notably, in the cases of Iksan and Gunsan, there is a noteworthy correlation where a substantial increase in nitrate concentration corresponds to a high percentage of agricultural area.
5. Discussion
Understanding changes in groundwater quality over time is crucial for effective management, and comprehending its correlation with meteorological parameters, such as precipitation, is key to better understanding the aquifer system, including vulnerability, pollution sources, and storage dynamics. The Geum River Basin stands out as one of the largest basins in South Korea, characterized by high groundwater use. The escalating total groundwater use in the country is linked to the yearly installation of numerous groundwater pumping wells. This upward trend signals the widespread expansion of groundwater exploitation throughout the country, prompting concerns about potential groundwater contamination if wells are not adequately maintained.
Given the pivotal role of groundwater in the Geum River Basin, it is essential to understand how groundwater quality is evolving over time. The present study aims to investigate changes in groundwater quality from 2005 to 2021 within the study region. To achieve this goal, the study employed the Mann-Kendall test to assess the trends of Precipitation, GWL, EC, and nitrate concentration across the study area. This statistical methodology utilized here for the tendency in groundwater quality has been successfully used across the world by many researchers. Case of Li et al. (2021), which employed Mann-Kendall test to assess temporal trends in nitrate and ammonium concentration in shallow groundwater in China. For the purpose of this study, the same technique was chosen to analyze the trend in groundwater quality in the Geum River Basin. Additionally, the magnitude of the trend for each parameter was estimated using Sen’s slope estimator, which was used by some research for the same purpose; the case of Jeon et al. (2020), which evaluates temporal trends in various groundwater quality parameters (pH, Na+, K+, etc.) across Korea using Mann-Kendall and Sen's slope estimator, providing insights into the magnitude of changes. Finally, a potential correlation between the parameters was studied to evaluate the impact and significance of each parameter on groundwater contamination within the study area. Also, to see a potential effect of the quantitative part on the qualitative part which will be developed in further research.
The Mann-Kendall analysis revealed variations in GWL, with increases and decreases observed across the study area. Decreases were prominent in most upstream districts, while an increasing trend was noted in some downstream districts. The decline in GWL in most upstream districts cannot be solely attributed to a decrease in precipitation due to the low correlation observed between precipitation and GWL across the basin (average correlation in the basin is 0.19). This low correlation indicates that groundwater recharge through direct infiltration in the basin is minimal. The analysis of precipitation data from 2005 to 2021 does not indicate a significant decrease in the upstream part of the Geum River Basin. Contrary to the decrease in groundwater level, most upstream districts showed an increasing trend in precipitation data. This suggests that factors other than precipitation decrease are contributing to the decline in GWL. The result of GWL decrease in the upstream, as observed in this study, was previously underlined by Lee and Moon (2008). The decline in GWL, especially in the upstream, can be attributed to groundwater use, which continues to increase annually due to the expansion of agricultural land, population growth, and industrialization. The intensive groundwater use in the study area was highlighted by a survey in 2020, revealing that groundwater utilization by administrative districts in the Geum basin area accounts for approximately 31% of national groundwater usage (KOSIS, 2023).
Mann Kendall test performed on EC showed positive values in many districts, indication that groundwater EC has notably increased in many districts. The increasing trend is found to be monotonic in eleven districts (Table 1). The eleven districts have shown that EC keeps increasing each year from 2005 to 2021 while others districts with uptrend have fluctuating trend. The Sen’s slope estimator showed significant change in EC in many districts with the highest increasing trend in Iksan and Jung-gu. Additionally, to EC increase, the Sen’s slope estimator applied to nitrate concentration showed also increasing trend in these two districts mainly in Iksan and Gunsan. The factors contributing to the rising trend in both EC and nitrate concentration in Iksan include an upsurge in agricultural activities, likely driven by the exchange of brackish water between groundwater and surface water. The impact of anthropogenic activities, predominantly from agriculture, is significant, given that more than 50% of the district's area is dedicated to agricultural use (Fig. 8). This trend of increasing EC and nitrate concentration is not limited to Iksan alone but is observed across the entire study area, with a similar upward trajectory in both parameters noted in Gunsan (Fig. 6). In both districts, where more than half of the total area is utilized for agricultural and livestock activities, EC and nitrate concentration have surged. Notably, the coastal districts of Seocheon, Gunsan, and Buyeo also exhibit increased values in both parameters, suggesting a potential intrusion of brackish water from the ocean, a consequence of intensive groundwater pumping. Proving that groundwater quality is getting worse from 2005 to 2021 in some specific districts such as Iksan, Gunsan, Jung-gu and Seochoen.
The trend in EC from 2005 to 2021 shows an increase from upstream to downstream, with elevated values observed in the midstream. This could be attributed to water-rock interactions causing the exchange of minerals between groundwater and the geological units of the region. While the nitrate concentration trend does not exhibit a spatial pattern, it tends to be higher in regions designated for agricultural and livestock activities.
Despite the increasing trend in nitrate concentration in certain districts (Iksan, Gunsan, Seocheon, Jincheon, Cheongju, Boeun, Geumsan, Nonsan, Buyeo, Cheongyan, Gongju, Jinhan, Sejong, Seogu, Sangju), the average nitrate concentration in all districts remains below the Korean drinking water quality standard of 44.3 mg/L. A similar observation applies to EC across the study area, with the maximum EC recorded from 2005 to 2021 being less than 1500 µS/cm (typical for drinking water EC, usually ranging between 0 and 1500 µS/cm). Groundwater quality in the study region showed continual deterioration in some region but still the concentration of the pollutants used in this research lower than the recommended standard, which made believe that groundwater quality degradation isn’t yet an emergency in the study region.
The findings of this research emphasize the need to alert relevant authorities about the necessity of controlling groundwater pumping and land use such as agriculture to ensure sustainable development. While the pollution alert from this study is not currently an emergency, it could escalate if current management practices persist. Previous investigations by Moon et al. (2009), had already highlighted groundwater quality deterioration and level decrease in regions with higher GWL decreasing rates. The research technique used in this study was previously used by Byeon et al. (2020), and after comparison, the results from the present study are acceptable for the purpose of this study.
For a comprehensive and reliable assessment of groundwater quality in the Geum River Basin, relying solely on groundwater parameters is insufficient. Future research will focus on the interaction between groundwater and the Geum River, evaluating the impact of surface water quality on groundwater quality in the basin, quantitative and qualitative aspect and examining the interaction between water and bedrock minerals. It is believed that these interactions significantly influence groundwater quality in the basin and must be considered for a reliable assessment of groundwater quality changes.
6. Conclusion
Groundwater quality faces significant threats primarily from the agricultural sector, which, under the influence of climate change, is altering cropping methods and employing more fertilizers to enhance yields. This study utilized the Mann-Kendall test and Sen’s slope estimator to evaluate changes in groundwater quality from 2005 to 2021, focusing on two key parameters: EC and nitrate concentration.
The analysis of EC and nitrate concentration revealed a deterioration in groundwater quality in the Geum River Basin from 2005 to 2021, despite government efforts. This decline in quality is attributed to several factors. Firstly, fertilizers leaching from agricultural land, intensified by heavy precipitation, contribute to the contamination of groundwater. Secondly, the downstream intrusion of saltwater results from extensive groundwater pumping for domestic, agricultural, and industrial purposes. Thirdly, water-rock interactions lead to the presence of minerals in groundwater, potentially explaining the elevated EC in some districts of the upstream and midstream areas.
The findings of this research align with previous studies, underscoring the challenges in achieving sustainable groundwater management in the basin. Consequently, it is imperative to consider the impact of anthropogenic activities and climate change on the ongoing deterioration of groundwater quality over time.
