

1. Introduction
2. Study area
3. Methodology
3.1 Nighttime light dataset
3.2 Geographical dataset
3.3 Flood-related dataset
3.4 Spatial distribution analysis
4. Results and discussion
5. Conclusion
1. Introduction
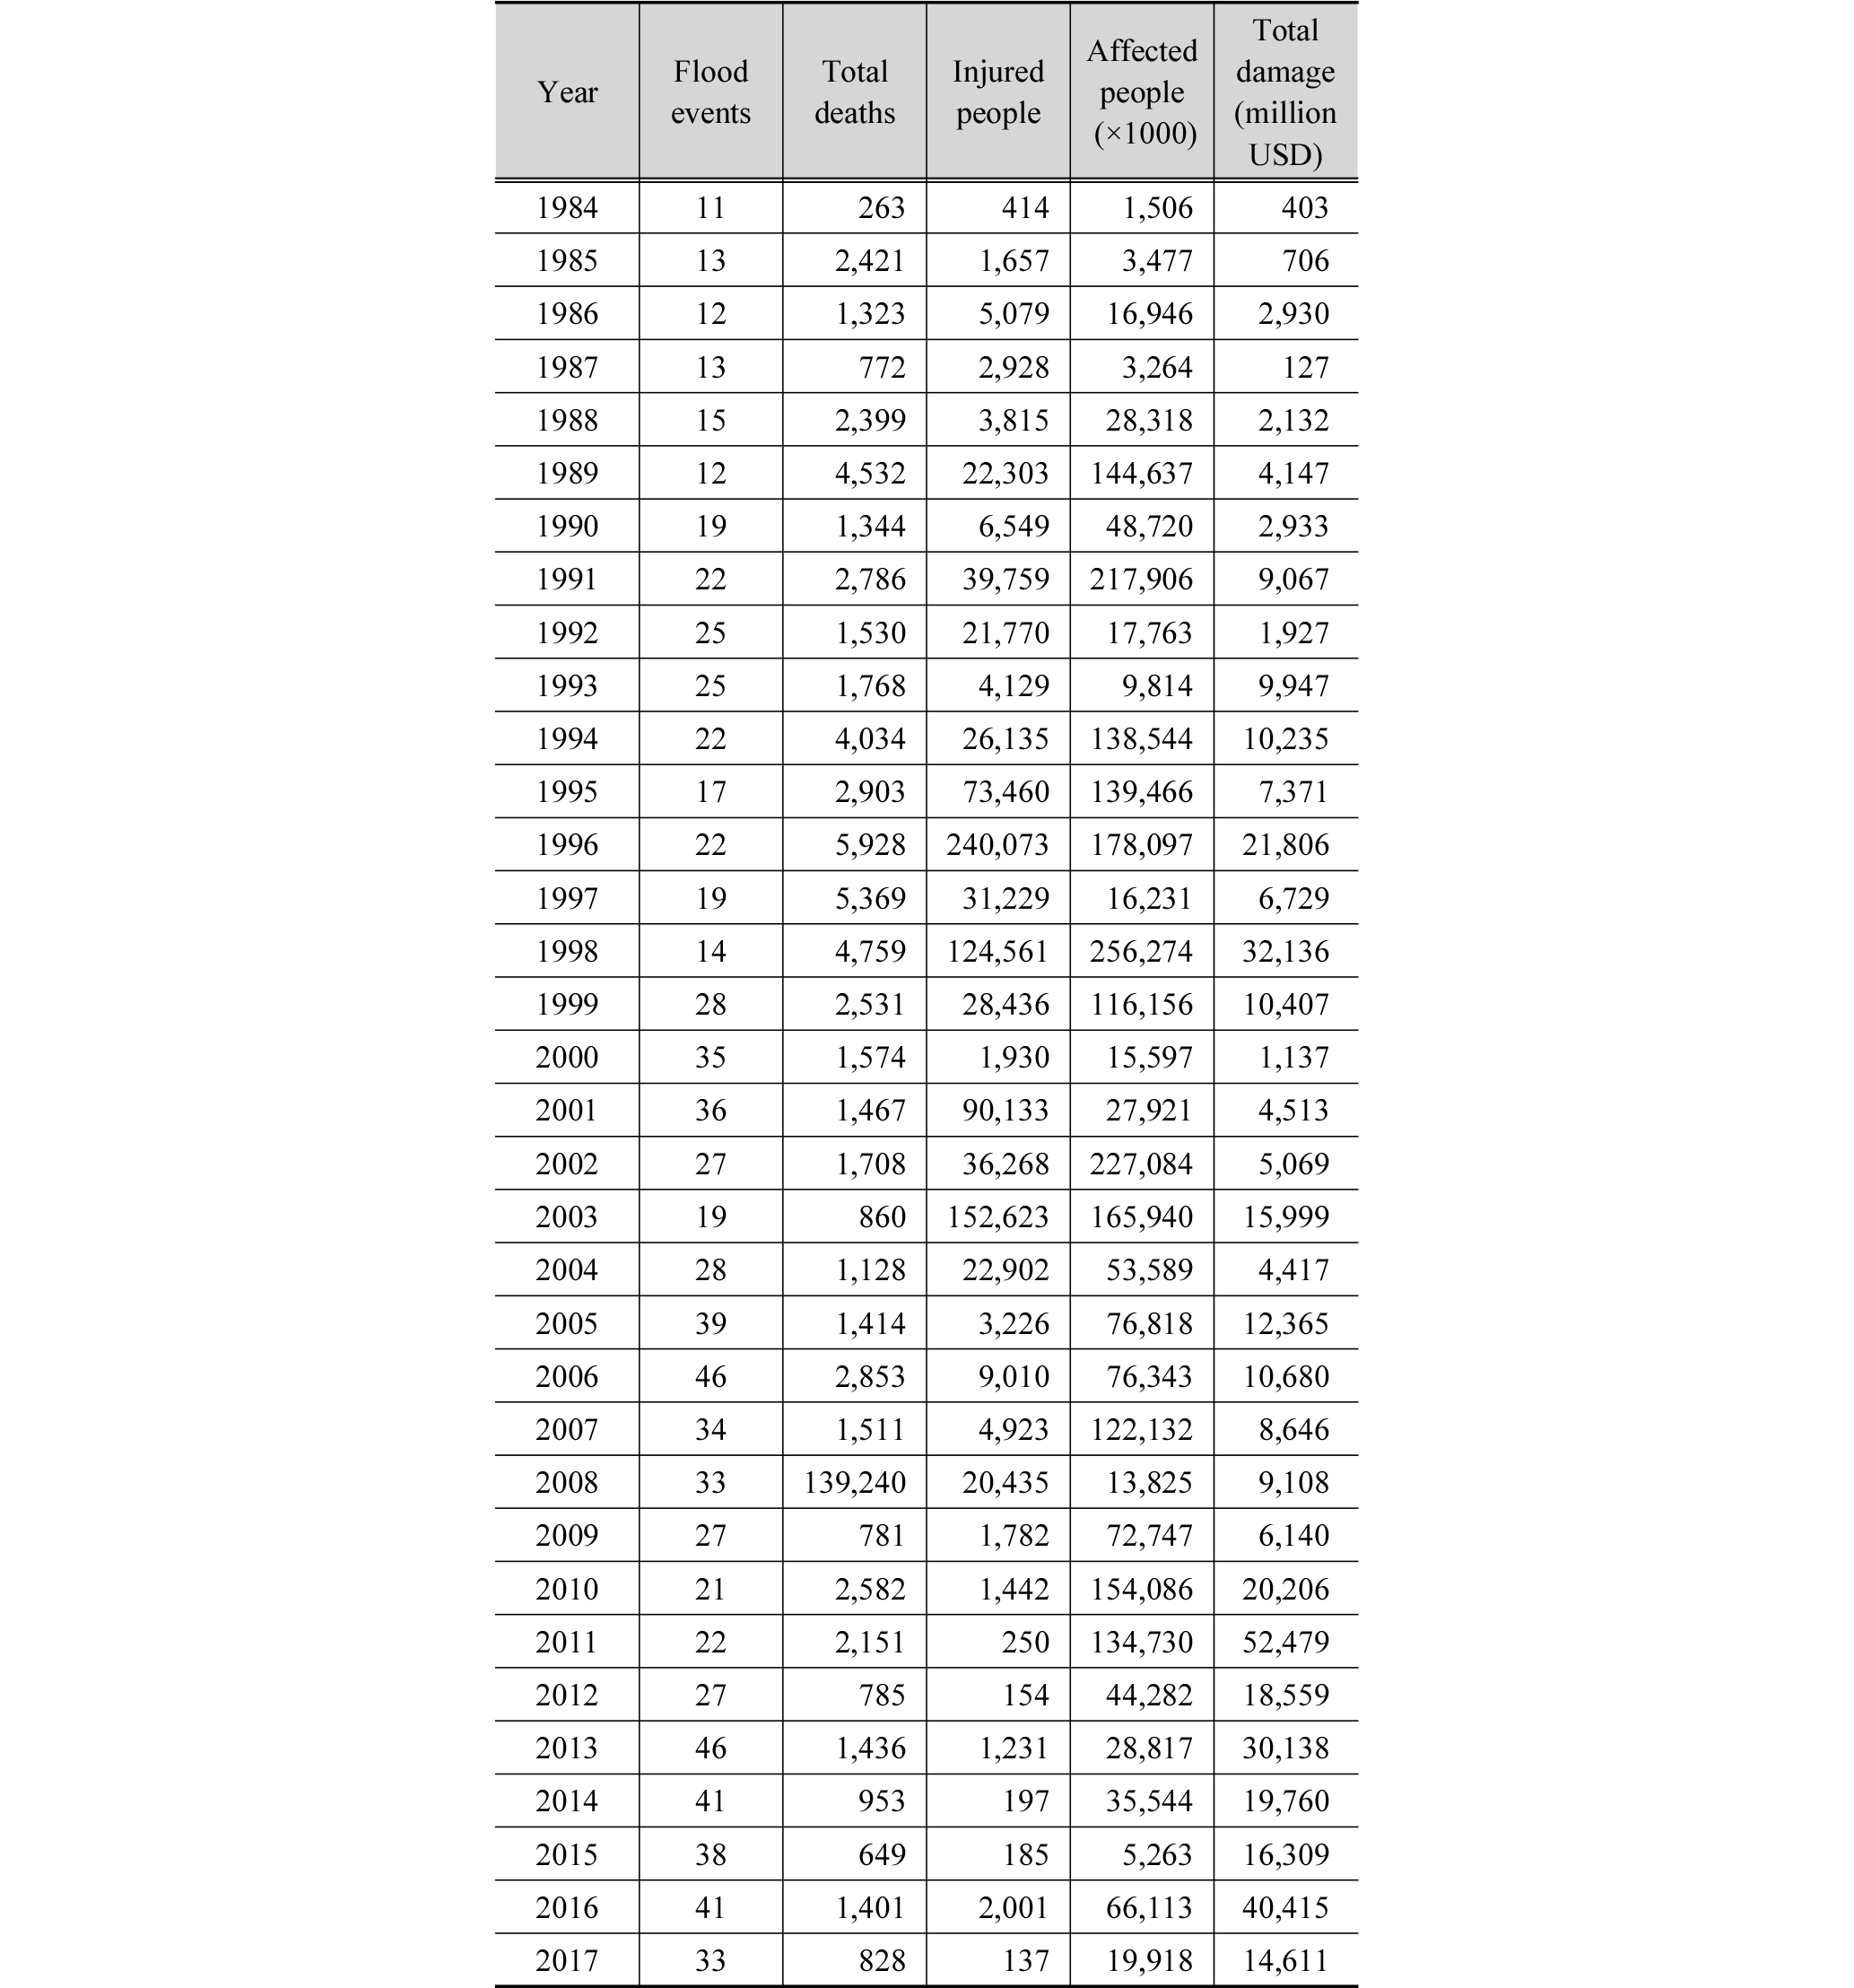
Floods have become widespread and frequent natural disasters and cause significant losses of lives and properties (Yilmaz et al., 2010). There were 8,835 global disasters reported from 1970-2012, accounting for 1.94 million deaths and US$2.4 trillion in economic losses (WMO, 2014). Floods consisted of 45% of the total number of disaster events and 60% of disaster-related economic damage in Asia. The average annual cost of floods in the Lower Mekong basin ranges from US$60 to 70 million, while the annual average benefit of floods is approximately US$8-10 billion (MRC, 2010b). In 2000, the flood was over an area of 45,000 km2 along the Tonle Sap floodplain and Mekong Delta caused over 800 deaths (MRC, 2005) and destroyed US$282 million properties in Cambodia and Vietnam (MRC, 2014). According to the EM-DAT database (http://www.emdat. be/database), the flood damage in the Greater Mekong Subregion countries (i.e., Cambodia, China, Lao PDR, Myanmar, Thailand, and Vietnam) has been dramatically increase since 1984 to 2017 (Table 1). Number of flood events and economic damage significantly raised during the last decade while total deaths, injured people, and total affected people were increased during the last two decades.
Table 1. Flood damage data of the greater Mekong subregion (Cambodia, China, Lao PDR, Myanmar, Thailand, and Vietnam) |
|
The proximity of human populations to streams is a matter of concern in terms of flood risk, environmental pollution, and the increase in human exposure of ecosystems rivers (Ceola et al., 2015). For instance, a substantial alteration in the hydrologic cycle in western United States during 1950-1999 was observed by variation in river discharge. High population density, particularly in deltaic settings in Asia, has a tendency to enlarge coastal flood risk as a consequence lower elevations (Nicholls et al., 2008). Human dynamics, urbanization processes, socioeconomic, and cultural developments play an important role in changing water cycle dynamics (Haddeland et al., 2014; Vörösmarty et al., 2000). Kummu and Sarkkula (2008) mentioned the remarkable increase in human impacts on water resources during the past decades. Changes in water dynamics are also related to surface development activities and land use changes (Slater et al., 2015). Floods always arise when river discharge reaches its annual maximum or peak. Flood risk is possibly induced by the population concentration in perifluvial areas (Jongman et al., 2012). In particular, several previous studies examined the increasing human impact and population proximity to streams and rivers over the past decades (Becker and Grunewald, 2003; Ceola et al., 2014, 2015; Jongman et al., 2012). Kummu et al. (2011) proposed a global analysis of population distance to freshwater bodies using LandScan TM 2007 population data. Their results, however, did not mention the temporal progress of human pressure to rivers. Recently, Ceola et al. (2014, 2015) used nightlight data to reveal increased human exposure to floods on a global scale.
Nighttime lights have been widely used as a proxy for population and settlement (Elvidge et al., 1997), economic growth (Chen and Nordhaus, 2011), electrical power consumption and distribution (Chand et al., 2009), poverty and development (Elvidge et al., 2009), and environmental issues, such as light pollution (Bennie et al., 2014). As a result, they found that nighttime lights close to streams and rivers are significantly affiliated with economic losses caused by floods worldwide. However, there is insufficient information from a regional perspective regarding flood impacts caused by human pressures, particularly for the Mekong river. Flood preparedness strategies do not respond in timely manner to the immediate risks of flood events, which has resulted in large damages in past decades. This paper aims to identify the areas where flood risks are subjected to frequently occur. To achieve this objective, we examined relationship between the nightlight satellite imagery with flood damage and the distance to stream network; explored the statistical correlations between distance class from river network and flood-related damages along the Mekong river.
2. Study area
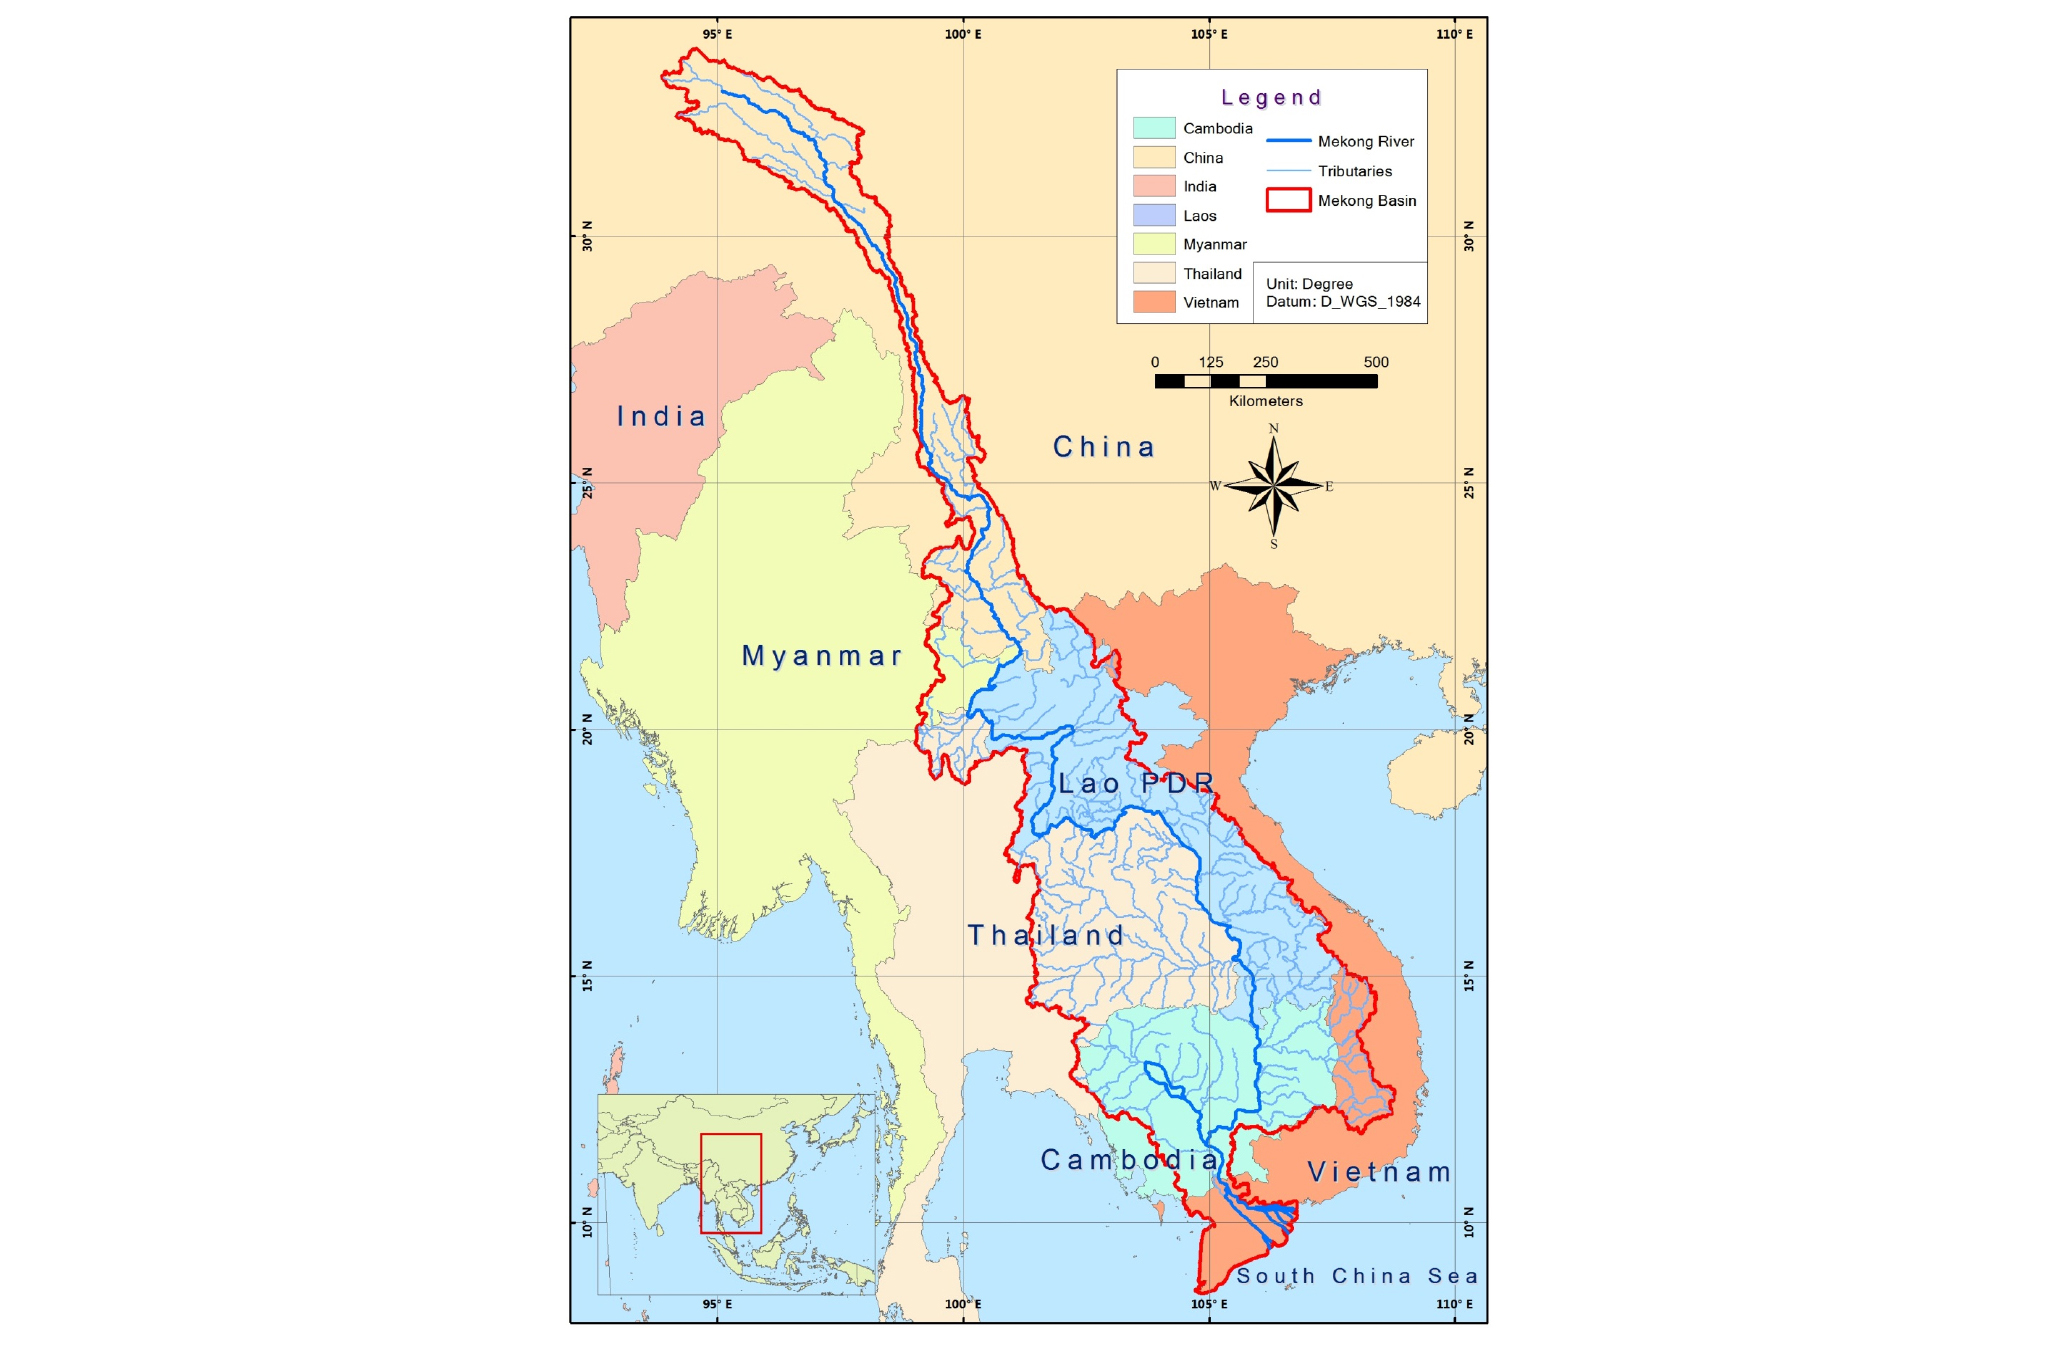
The Mekong river system, a transboundary river in Southeast Asia, is one of the world largest rivers, ranking 12th in terms of length and 8th in terms of mean annual discharge at the mouth. The Mekong river starts from the Tibetan Plateau and flows through China, Myanmar, Lao PDR, Thailand, Cambodia and Vietnam before emptying into the South China Sea (Fig. 1). Its estimated length is 4,909 km, and it drains an area of 795,000 km2 (MRC, 2011). Its mean annual discharge is approximately 475 km3 (MRC, 2005), and its monthly discharges vary significantly between the wet season (June to November) and dry season (December to May) as a result of the Southwest Monsoon. About 60 million people are living along and depend on the Lower Mekong basin for food, income, health, and cultural identity. The river rises in high mountainous areas, passes through the Tonle Sap floodplain, and empties into the sea via the delta area.
3. Methodology
3.1 Nighttime light dataset
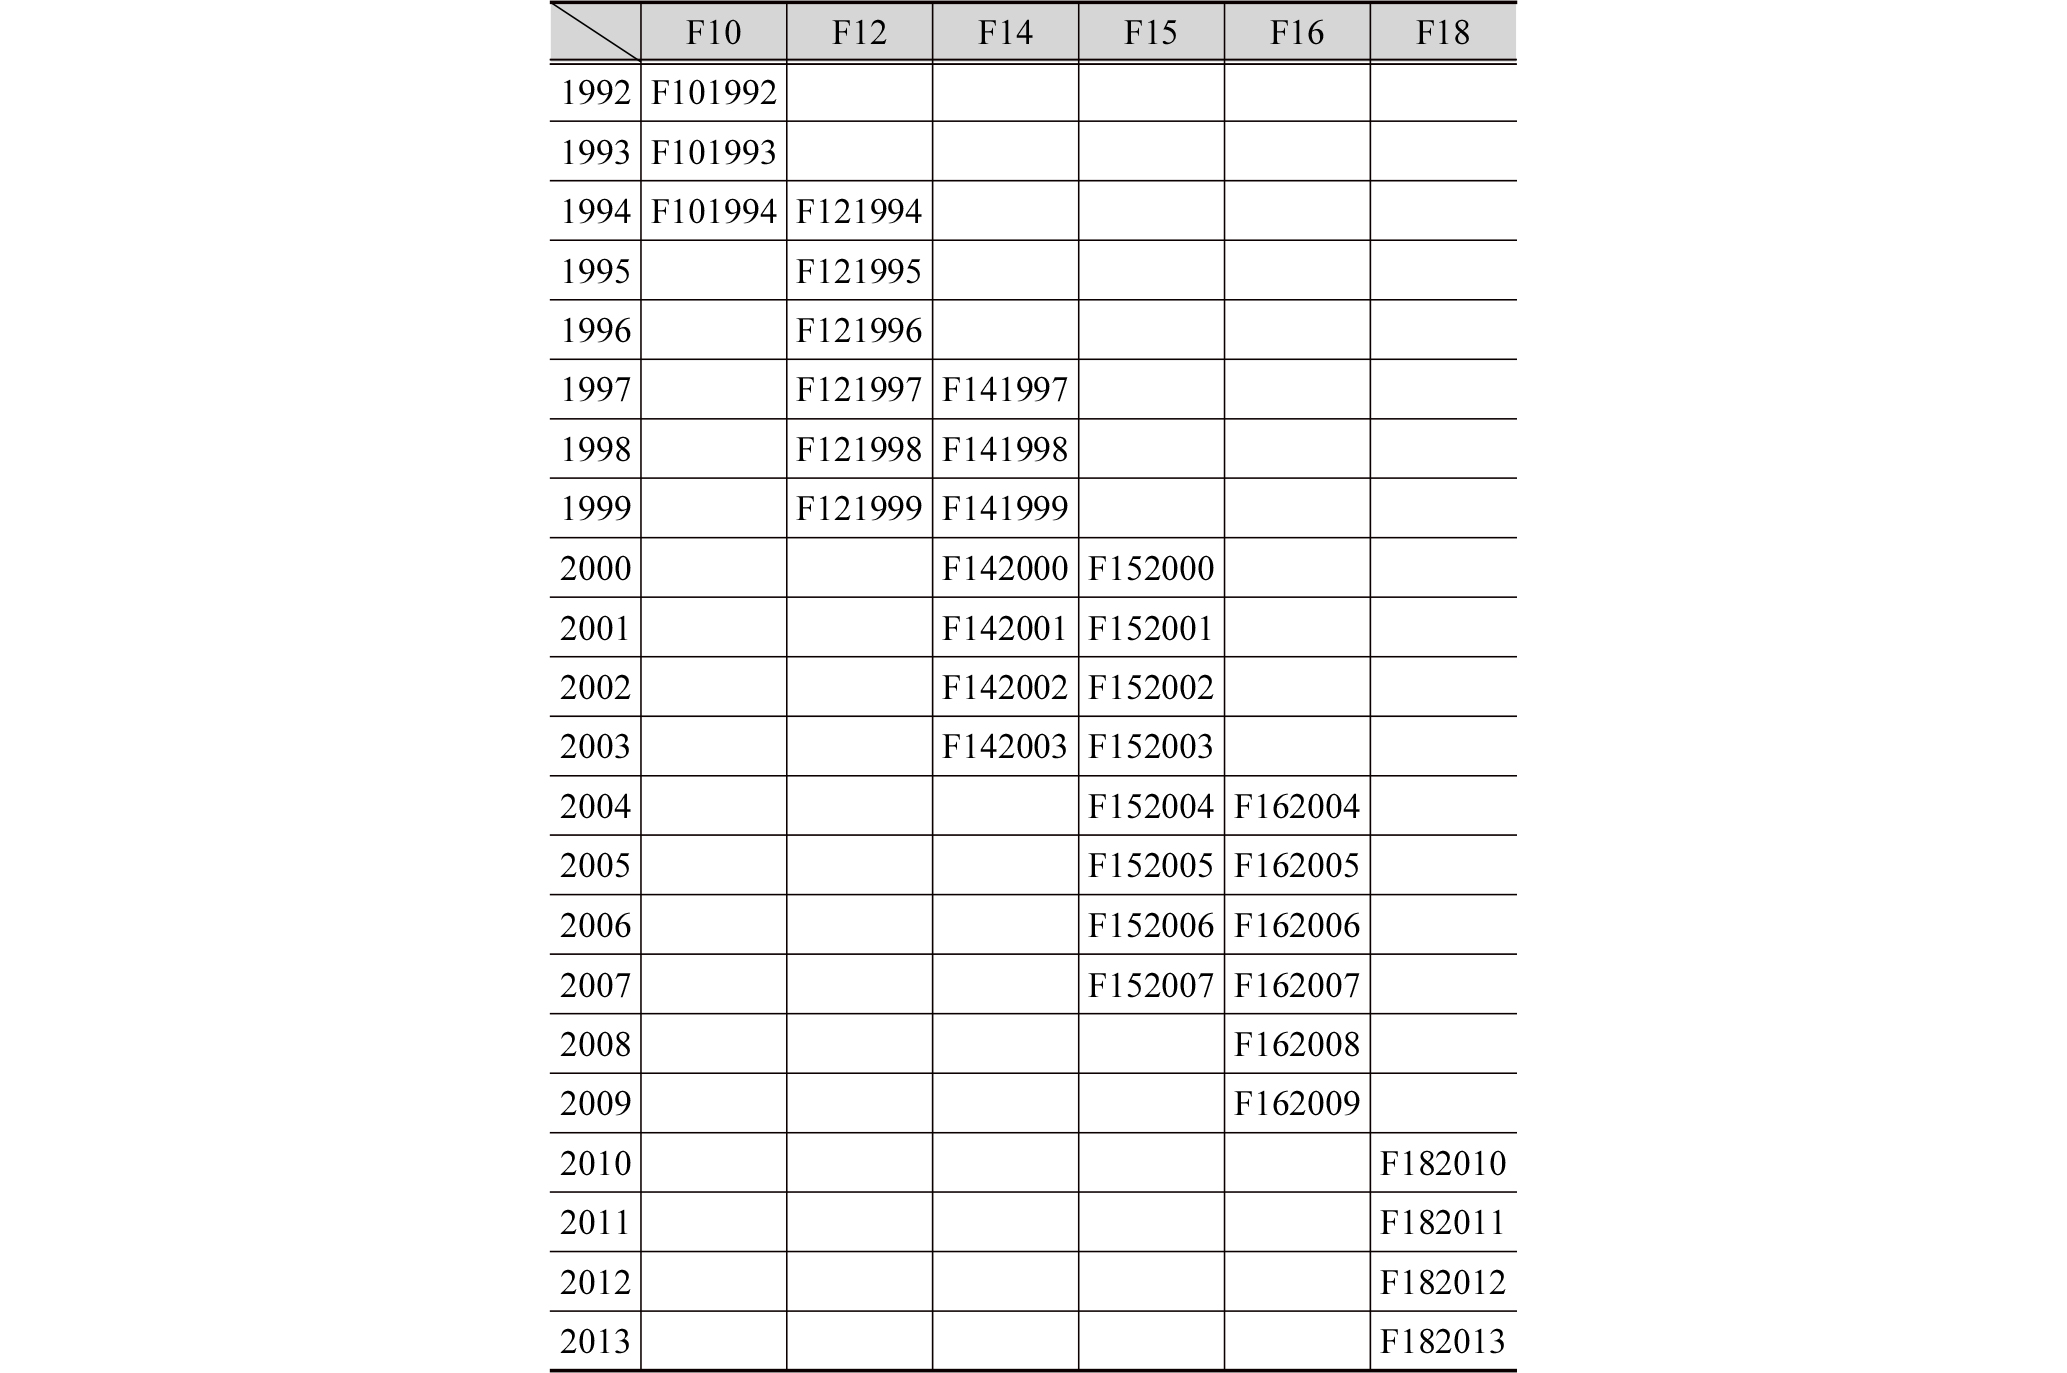
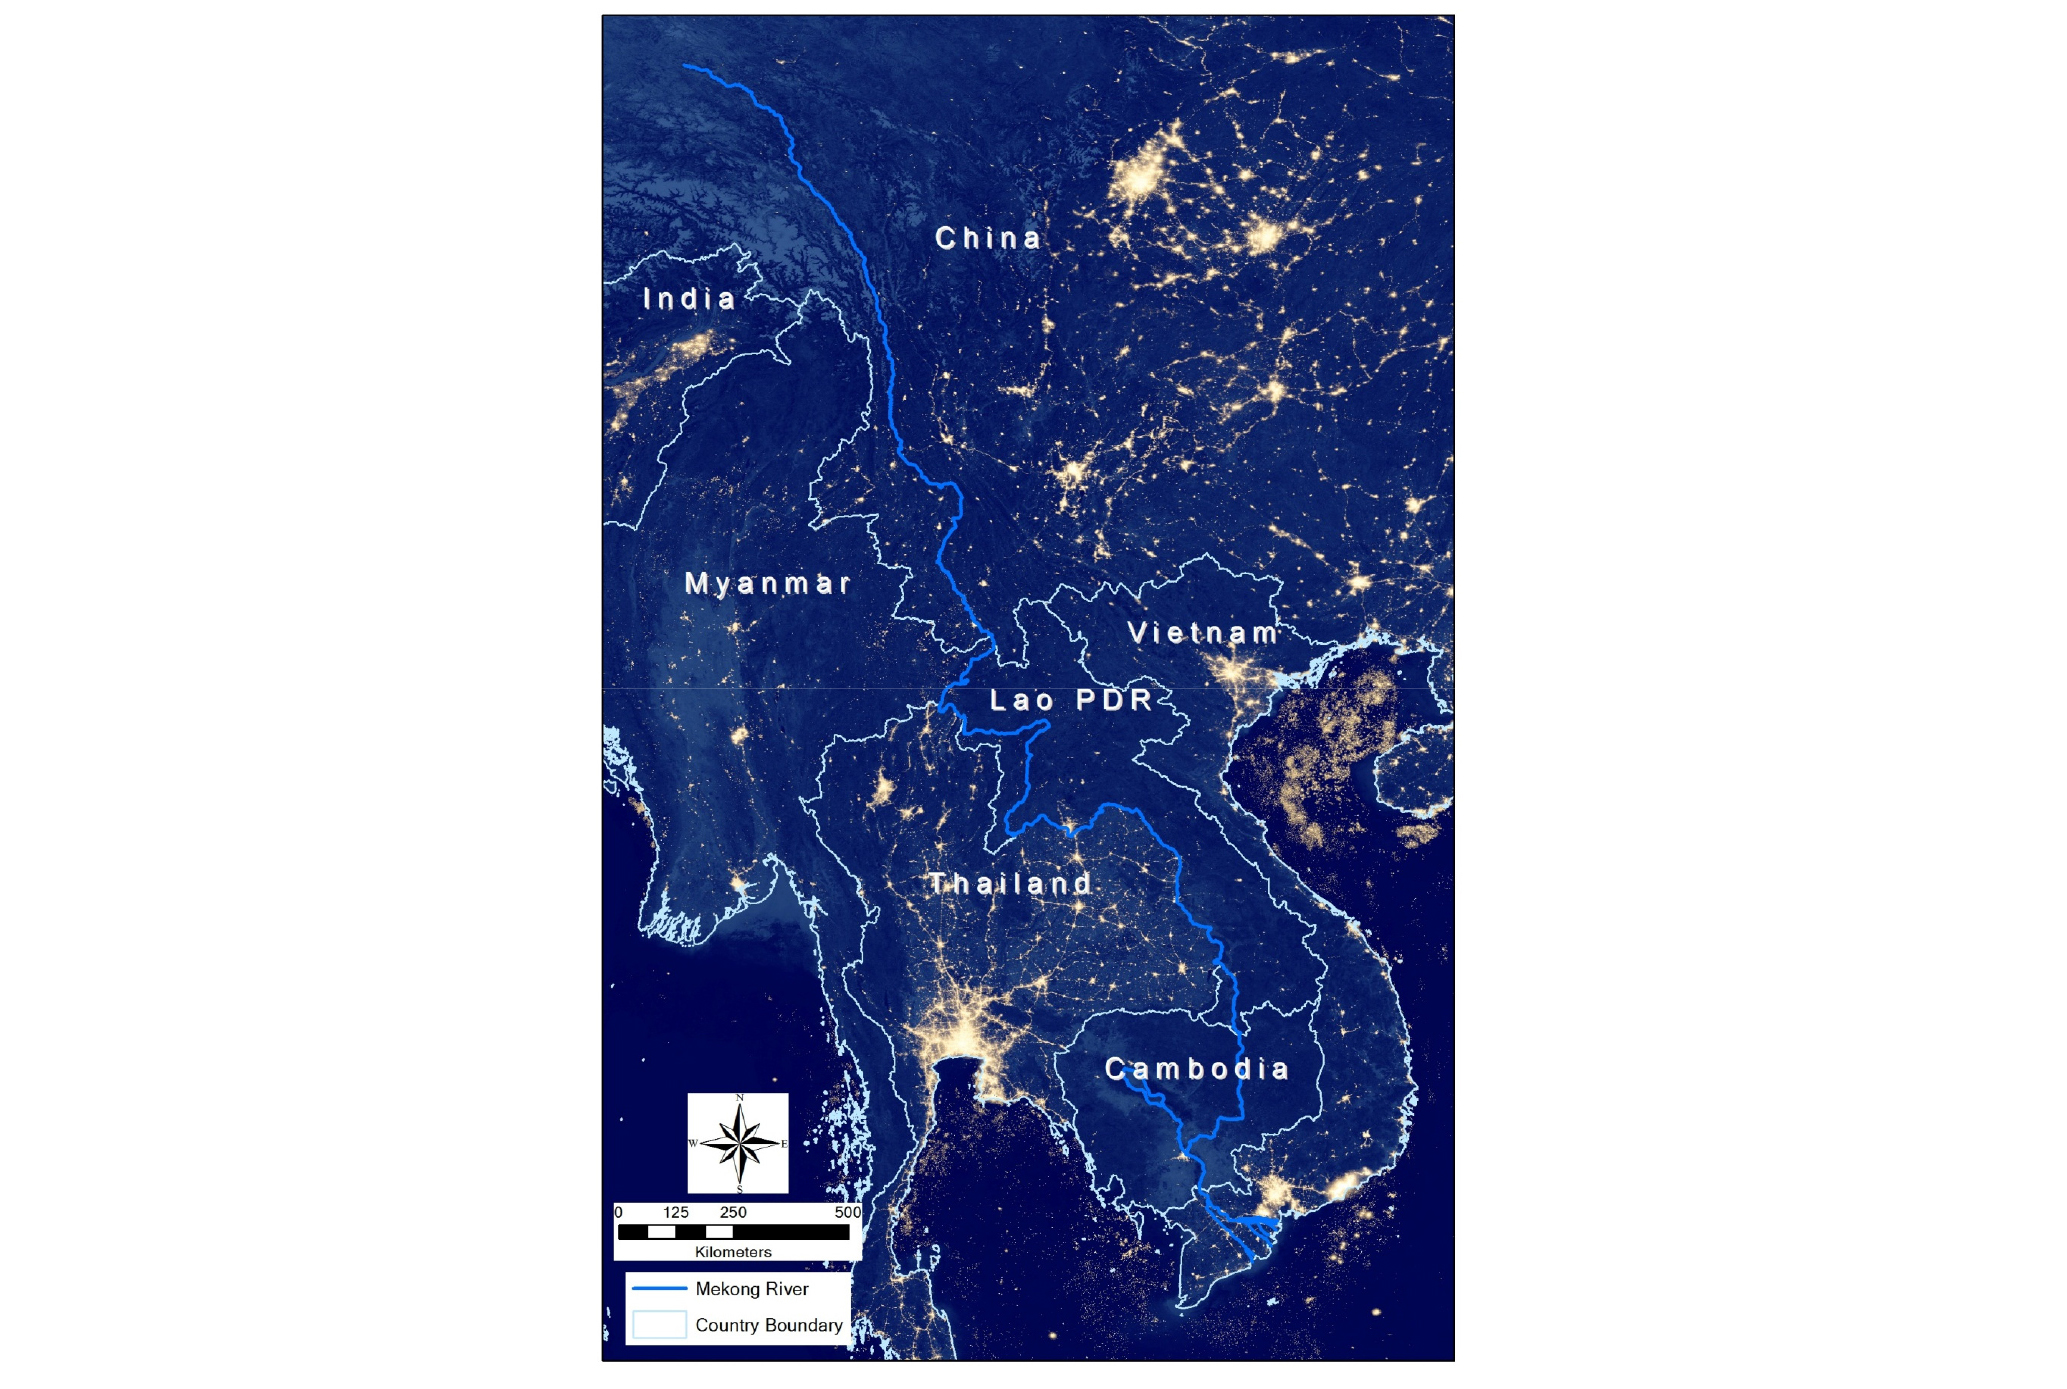
Digital nightlight series were surveyed by the US Air Force Weather Agency under the Defense Meteorological Satellite Program (DMSP) by operating six satellites carrying the Operational Linescan System (OLS). The products are freely downloaded from the National Oceanic and Atmospheric Administration (NOAA, 2016) of the National Geographical Data Center. The nighttime light dataset covers a 22-year period from 1992 to 2013 (Table 2). The data comprise detected lights from cities, towns, industrial sites, and gas flares. Some irrelevant information such as sunlight, moonlight, glare, ephemeral incident, cloud, and aurora light were excluded from the observation. Nighttime light time series are expressed by yearly averaged digital number (DN) value, which range from 0 to 63, representing the condition of completed darkness and brightness areas, respectively. The original data sets are in raster format (GeoTiff) with a spatial resolution of 30 arc sec (0.00833°), corresponding to nearly 1 km at the equator. The data sets are cloud-free composites made using DMSP-OLS smooth resolution data. Two satellites were operating simultaneously in during some years (1994, 1997, 1998, 1999, 2000, 2001, 2002, 2003, 2004, 2005, 2006, 2007); therefore, a new satellite raster image is calculated by averaging the overlapping satellites (Table 1). The available dataset extends from -180 to +180 degrees longitude and -65 to +75 degrees latitude. Fig. 2 shows the nighttime light over Mekong country region in 2012 obtained from NASA Earth observatory (online available at http://visibleearth.nasa.gov/view.php?id=79765).
3.2 Geographical dataset
The United States Geological Survey (USGS) Hydrological data and maps based on SHuttle Elevation Derivatives at multiple Scales (HydroSHEDS) were employed to analyze geographical data of the Mekong river basin for this study (Lehner et al., 2008). HydroSHEDS data is primarily based on elevation data obtained during NASA’s Shuttle Radar Topography Mission (SRTM). HydroSHEDS has been developed by the World Wildlife Fund (WWF) to support regional and global watershed analysis, hydrologic modeling, and freshwater planning (Lehner et al., 2006). The data covers a large range of spatial resolutions, starting from 3 arc sec, and covers nearly ±60 degrees latitude. As such, the river network, digital elevation model (DEM), and flow direction were selected with the same spatial resolution as the nighttime light data (i.e., 30 arc sec) to use in this research. The HydroSHEDS data has been widely used in many research on flood prediction, stream flow forecasting and early flood warming at global scale (Alfieri et al., 2013; Getirana et al., 2009; Li et al., 2009).
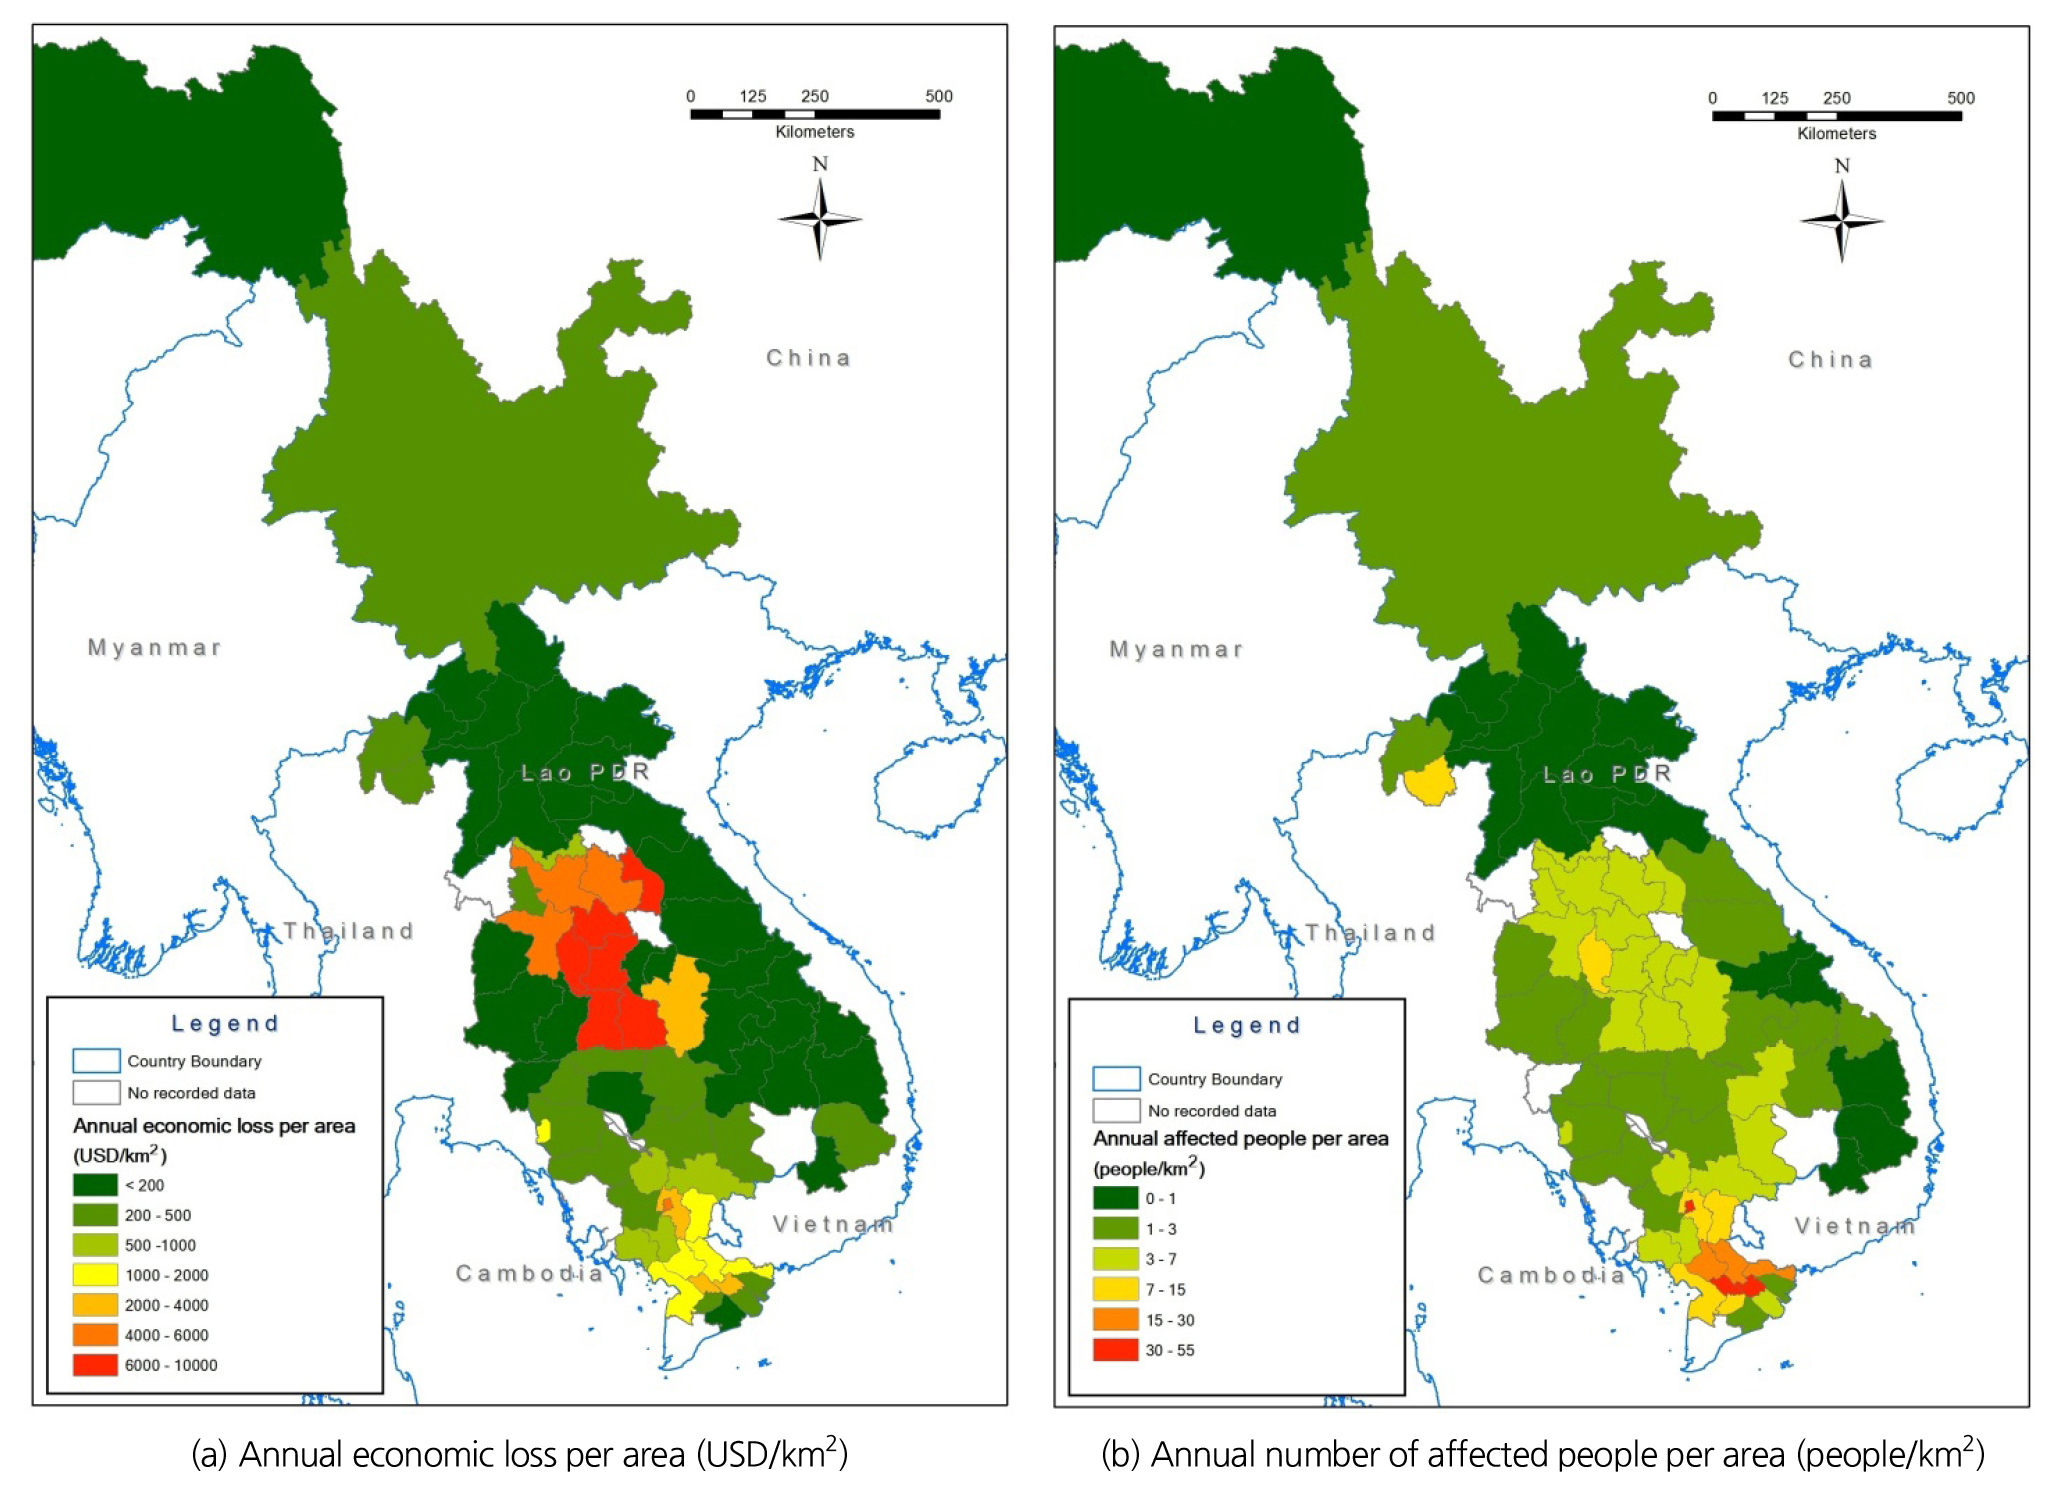
3.3 Flood-related dataset
Temporal data of flood-related socio-economic losses and affected people at the provincial scale have been assessed from the Emergency Event Database (EM-DAT, 2016) to evaluate the relationship between nightlight intensity associated with flood damages in the Mekong river basin (Fig. 3). EM-DAT dataset was developed by the Centre for Research on Epidemiology of Disaster (CRED). EM-DAT disaster databases are categorized by event date, specific location within each country, natural/technological disaster types, and disaster elements. The data representing the damage caused by flooding include economic losses in US Dollars and number of affected people. EM-DAT is one of the most recognized international natural databases that have been used by many studies: Andrewin et al. (2015) to investigate risk factors for storm lethality and flood, Guha-Sapir et al. (2014) to analyze annual disaster statistical review in Belgium, and Mitchell et al. (2014) to study on the reduction of disaster risk in UK.
3.4 Spatial distribution analysis
The direction of each cell to its steepest downslope neighbour was considered in eight directions (Fig. 4(a)). We determined the distance from the center of target cell to the nearest edge of river cell following the direction of flow direction. Fig. 4(b) shows flow sample distances for the whole Mekong river basin. All river network cells were considered as the direction of steepest descent. The Flow Length tool in ArcGIS was used to create distance-area diagrams. The required input for the Flow Length tool is flow direction in grid raster format integrated with the weight raster as impedance to movement of downslope. The values of 0 and 1 were set as weighted distances along the flow path to river network cells and slope cells, respectively.
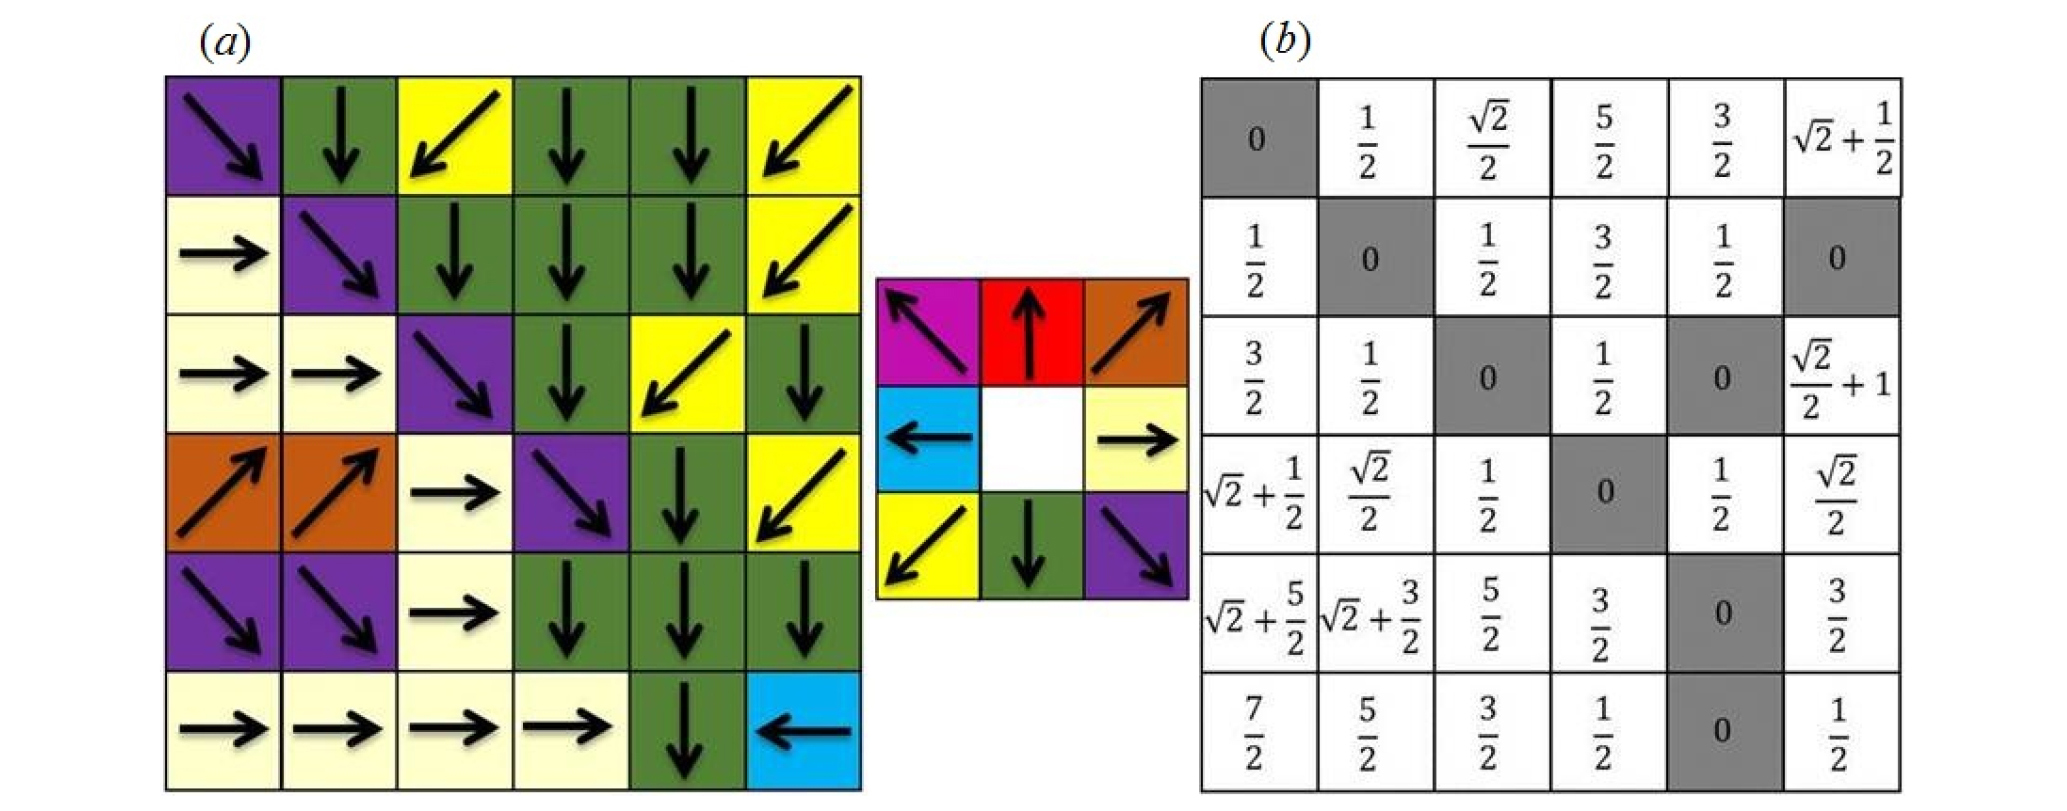
The flow length was overlaid with the temporal averaged nighttime light digital number during the considered period (1992-2013) to examine the distribution correlation. EM-DAT flood related-damages were defined in terms of the amount of damage per unit area. Flood economic losses are expressed in US dollars per square kilometer, and affected people are expressed in terms of number of people per square kilometer. Next, spatial distribution analysis presents the relationship of spatiotemporal average nightlights from 1992 to 2013 to flood economic losses (USD/km2) and affected people (people/km2).
4. Results and discussion
Significant statistical relationship was identified between the temporal average nightlight digital number (DN) and flood related-damage (i.e., economic loss per unit area and total affected people per unit area). Overall, the results state that higher nightlight values correspond to large flood related-damage in the Mekong river basin (Fig. 5). Each country was considered separately. Some countries (e.g., Cambodia and Lao PDR) carry low economic losses, and some remote areas do not have access to enough electricity, causing nightlight intensity to be inferior. Some other countries (e.g., Thailand and Vietnam) have higher nightlight value and flood related damage. Extreme floods (e.g., flood year 2000, 2001, 2002, 2009, and 2011) caused serious socioeconomic losses, human deaths, and homelessness (MRC, 2009), without considering the positive impacts of flood to ecological and socioeconomic function. For instance, flood inundation caused by the Ketsana typhoon in 2009 caused damages of US$132 million in Cambodia, US$800 million in Vietnam, US$58 million in Lao PDR, and US$21 million in Thailand (MRC, 2010a). Myanmar was neglected from this study because no flood information was recorded inside the country.
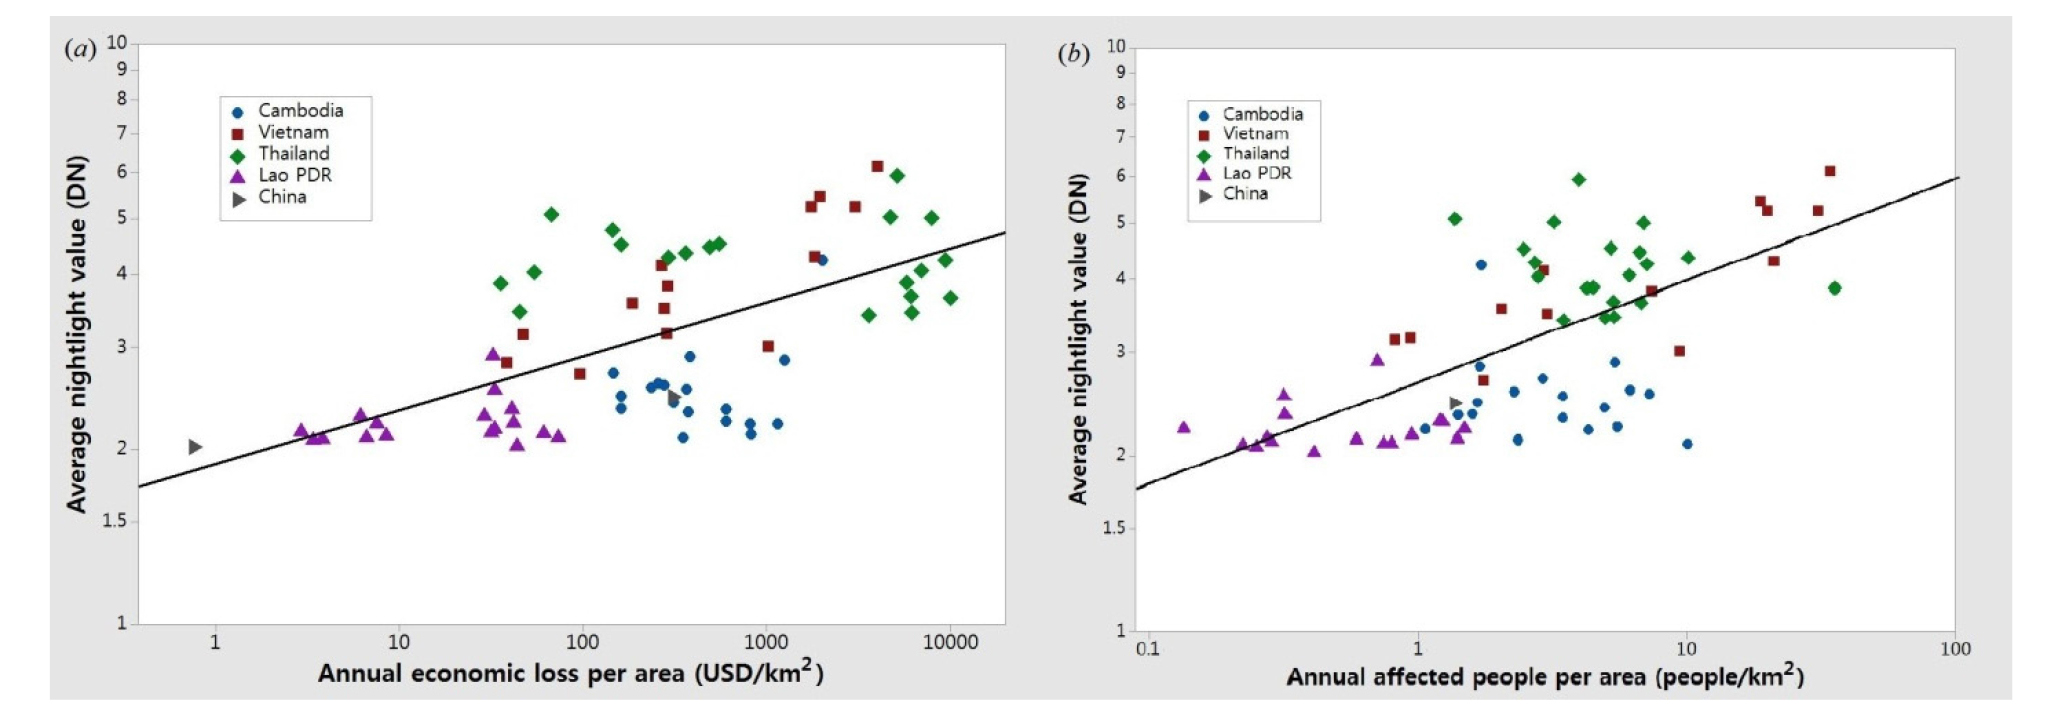
Fig. 5.
Relationship between average nighttime light value in the Mekong river basin during the considered period 1992-2013 associated with (a) economic losses per unit area (USD/km2; R = 0.47, p-value <0.001) and (b) number of affected people per unit area (people/km2; R = 0.62, p-value <0.001). Dots represent provinces located in inundated areas in each country
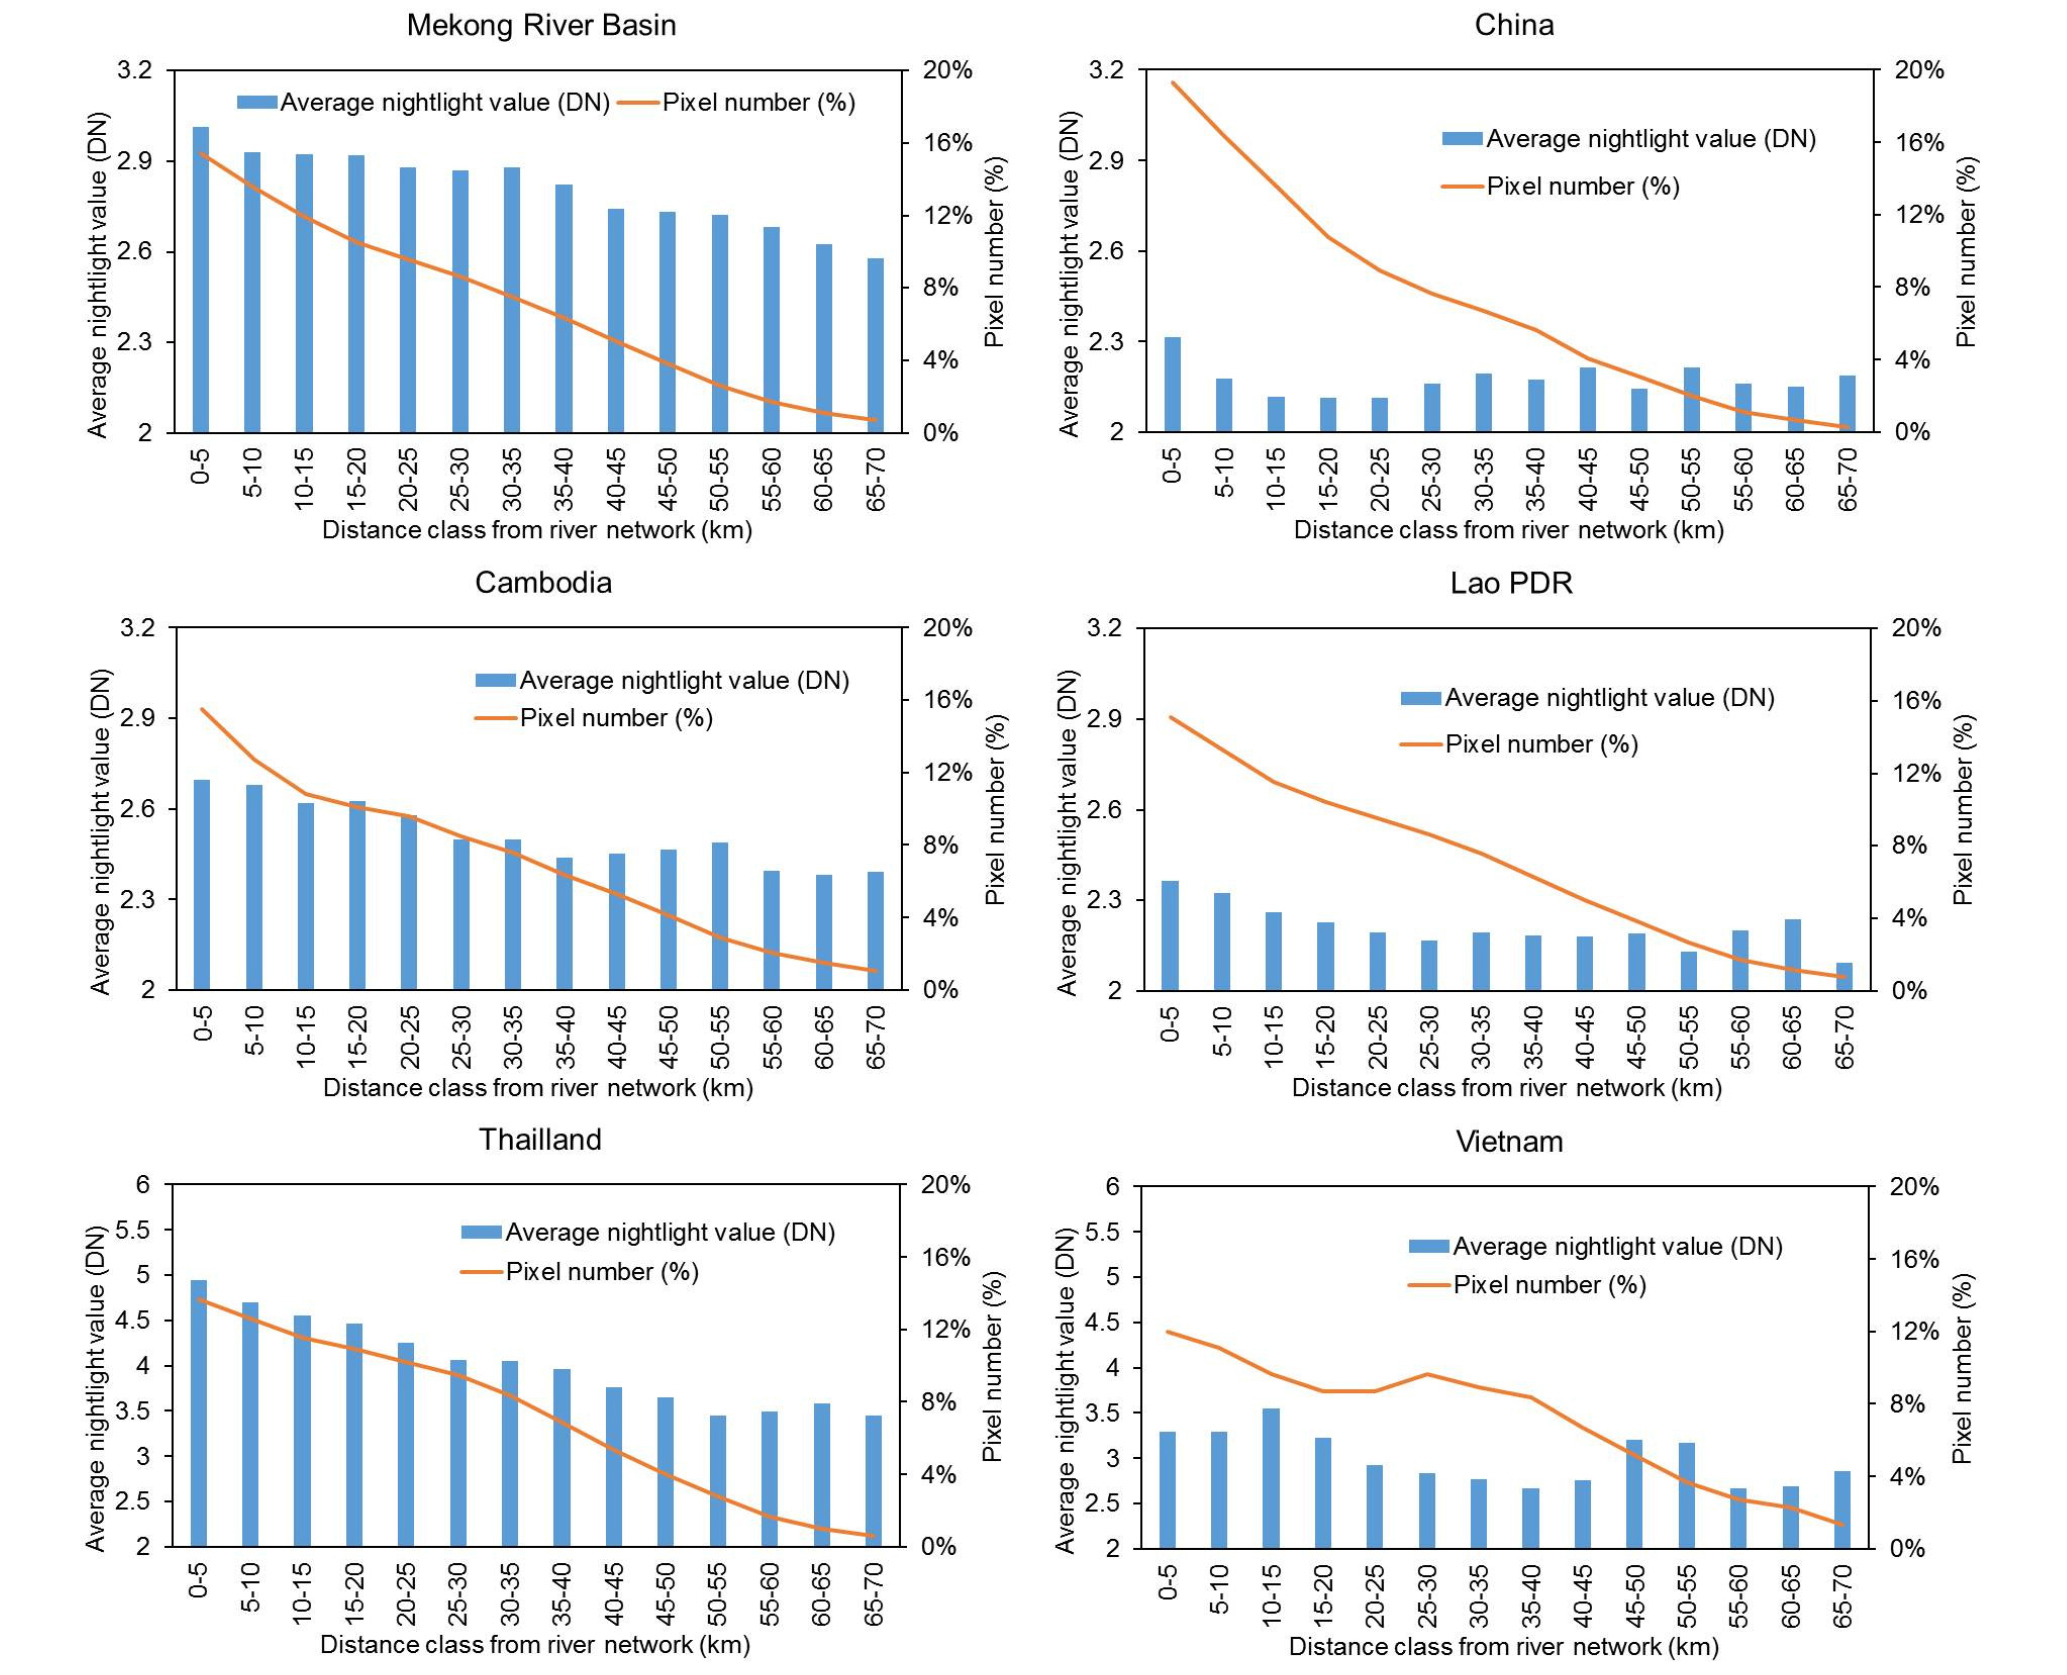
Fig. 6 illustrates the relationship between the temporal average nighttime value and the distance from river network within the considered period 1992-2013 for the entire Mekong river basin and each individual country. The result points out that areas close to the river network correspond to high nightlight values; coincidentally, lower values are located in more remote areas in the basin as well as Cambodia, China, Lao PDR, Thailand, and Vietnam. In the case of Cambodia, nighttime light intensity nearly decreases linearly from 2.7 to 2.39 of DN values from river network toward the area buffered 70 km. Most of large cities in Cambodia causing an increase in nightlight intensity are located along the river banks (e.g., Phnom Penh, Battambong, Siem Reap, Kompong Cham, Kratie and Stung Treng). For China, the nocturnal value sharply declines, but it rises slightly at 25 km until falling again at 55 km. The nocturnal light intensity in Lao PDR decreases and steadily keeps almost the same value. More than one-third of Mekong river contained in Lao PDR. The main cities are along main the river embankment (e.g., Luang Preahbang, Vientiane, Sovannakhet, and Champasak). These are factors that cause the population density to vary from high to low at further areas from river network. A similar case occurs in Thailand. Nighttime intensity dramatically decreases for entire distance classes. The reasonable inference is that the massive cities (e.g., Ubon Ratchathani, Si Sa Khet, Khon Kaen, Chaiyaphum, and Nakhon Ratchasima) are positioned along or near the main tributaries of the Mekong river. In Vietnam, a fluctuating trend is observed during the decline of nighttime light values. Overall, the average nightlight intensity gradually decreases, with respect to further buffering distances from river network in the main stream of the Mekong river and its tributaries. In summary, the nocturnal luminosity intensity representing human population impacts to flooding significantly decreases in the area further from the river network of the Mekong river basin. The trend continuously descends in Cambodia, Lao PDR, and Thailand, while decrease and fluctuation are also found in Vietnam and China.
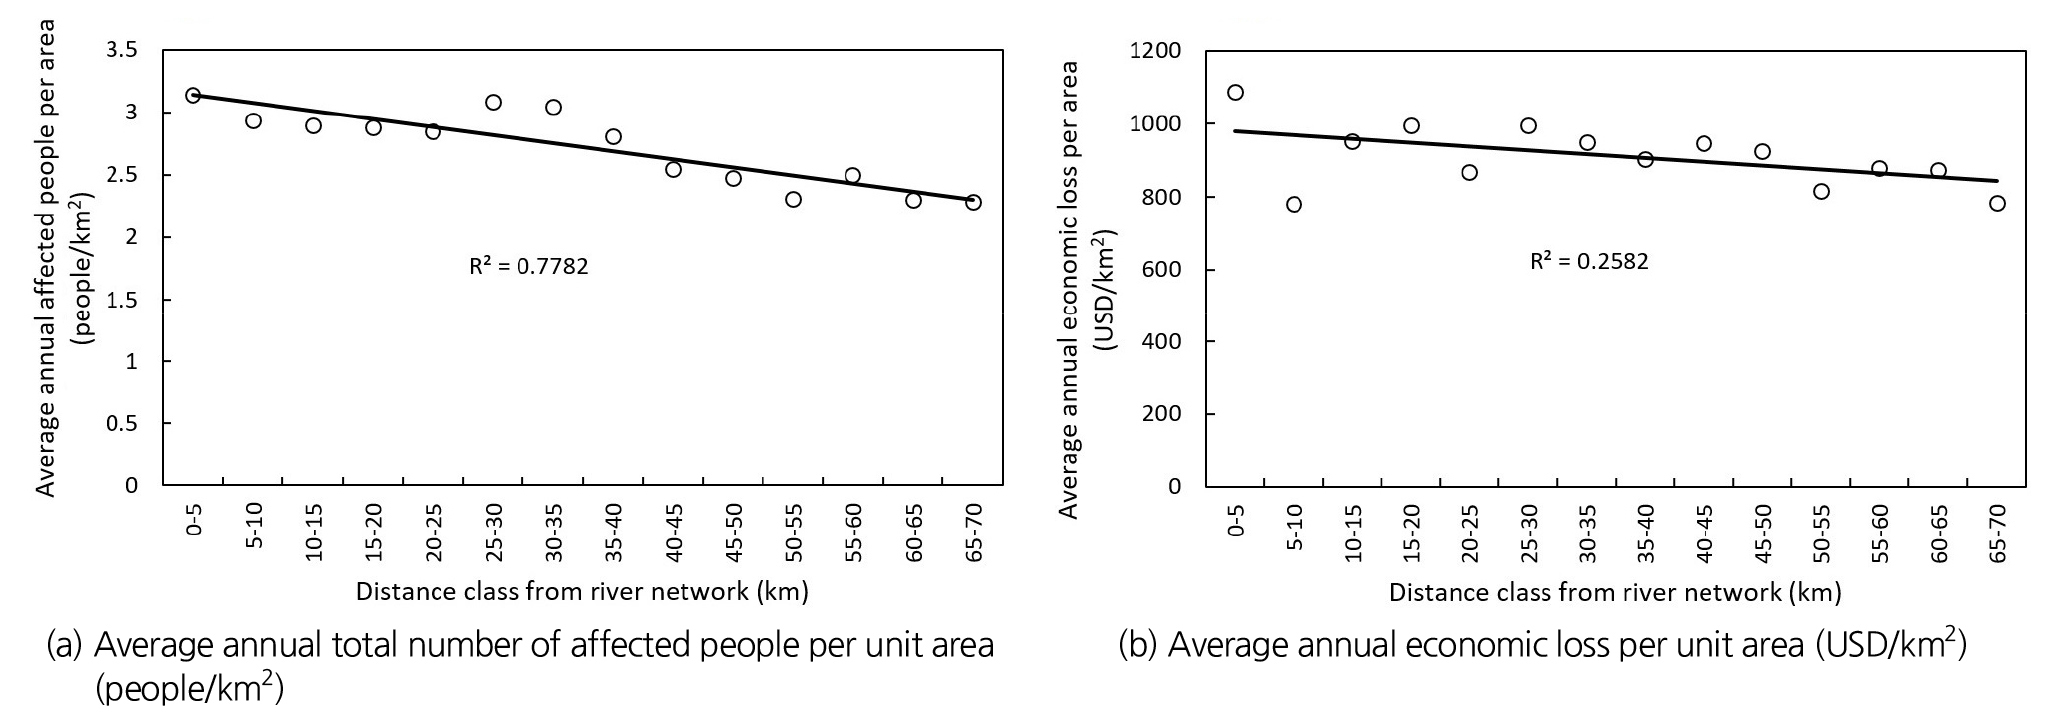
On the other hand, the linear regression (Y = aX + b) was used to identify the correlations between average annual total number of affected people per unit area (people/km2) and distance class from river network (Fig. 7(a)) for the entire Mekong basin with R2 = 0.7782, slope a = -0.0647, and intercept b = 3.2029. The statistical correlations of average annual economic loss per unit area (USD/km2) and distance class from drainage network (Fig. 7(b)) were R2 = 0.2582, slope a = -10.483, and intercept b = 990.36. The results clearly identified that the areas closer to the stream network in the Mekong river basin confront with high flood-related damage (i.e., number of affected people and economic loss) while the further areas from river networks correspond less flood hazard risk.
5. Conclusion
In this paper we investigate the presence of human distribution and the flood damage along the stream in Mekong river region. The satellite-based nighttime light was used as tool representing human presence and economic activity from 1992 to 2013. Nightlight values were then associated with class of distance to river network to perform the spatial distribution. We associated flood-related damage (i.e., economic losses per unit area (USD/km2) and number of affected people per unit area (people/km2)) with spatiotemporal average nightlight values at a provincial scale of each country in Mekong river basin. The flood-related damage was also correlated with flow distance class from the stream network.
The results revealed a significant correlation between nightlight satellite imagery and economic losses and number of affected people caused by flooding. The areas close to the rivers and streams correspond to high population density and huge flood damage. Nightlight satellite imagery is an effective monitoring technique on studying about human exposure on floods. The benefit from this results may provide key information in flood preparedness and identification of region in flood mitigation strategies. However, policy on reduction of electricity consumption and some remote areas that could not access to electricity yet may influence on uncertainty in this study. The limitation of this study was that it could provide the information on general of trend of flood risk assessment, but it could not give information of flood hazard risk on any the specific location of the study area. To obtain the flood risk on exact area, we suggest to use geomorphological approach to delineate flood area or flood inundation modeling.
