

1. Introduction
2. Materials and methods
2.1 Study area
2.2 Climate and hydrology data
2.3 Hydrological model: PRMS model
2.4 PRMS parameters and hydrologic model performance
2.5 GCMs downscaled data
2.6 Projecting the future runoff
3. Results and analysis
3.1 Calibration and verification of PRMS model
3.2 Possible changes in precipitation and temperature in dry and wet season
3.3 Relative changes (%) of actual evapotranspiration during dry and wet season
3.4 Relative changes (%) of streamflow during dry and wet season
4. Discussions
5. Conclusions
1. Introduction
Water management decision makers are faced with multiple challenges about the uncertainty of water supply and demand associated with climate change (Burnham et al., 2016). Global warming due to increasing emissions of greenhouse gas concentrations by human activities will intensify the spatio-temporal variability of streamflow amount and cause to more frequent floods and droughts during the twenty first century (Kundzewicz et al., 2007; Barnet et al., 2008). Therefore, it is necessary to investigate the variations of runoff for water resource management in each river basins to plan for control the flood and supplying water for different water uses, including agriculture, municipaluse, irrigation and hydropower generation.
However, because of climate change water resource managers cannot rely on past statistics of runoff (Chang and Jung, 2010). For this reason, the Global Circulation Models (GCMs) were used. The new generation of GCMs participating in the Coupled Model Intercomparison Project Phase5 (CMIP5) have advancement in physical parametrization and increase in horizontal resolution compared to the previous generation of models, like Fourth Assessment Report (AR4) (Eum and Cannon, 2017). For the Fifth Assessment Report (AR5), the scientific community has defined a set of four new scenarios, denoted Representative Concentration Pathways (RCPs), namely RCP2.6, RCP4.5, RCP6.0, and RCP8.5. The RCP4.5 and RCP8.5 scenarios are widely used at GCM models of AR5.
There are some studies by using the CMIP5 scenarios in the Korean River basins. Yoon and Cho (2015) assessed the uncertainty of extreme rainfall in the near future (2011-2040) over the Korean peninsula using CMIP5 scenarios. Hong et al. (2018) investigated the future extreme drought of the five major river basins of Korea using CMIP5 GCMs for various drought indicators. Hwang et al. (2018) evaluated the skills of CMIP5 GCMs in reproducing spatial climatology of precipitation over the coastal area in East Asia. They found that MPI_ESM_MR and CMCC family of GCMs showed better performance specifically for the Korean peninsula, however, Hadley-centre affiliated models comparatively performs better for the meso-scale area in East Asia.
The above mentioned studies provide useful information for the future conditions of the Korean River basins by using CMIP5 GCM scenarios. However, there is no study which evaluated the future streamflow conditions of the Korean River basins during the wet and dry seasons. In Korea, around two- third of the annual precipitation occurs during the wet summer monsoon while the winter season is dry and cold. This seasonality in precipitation causes to increase the flood risk in summer, as well as drought in winter. The results of the previous study in South Korea showed that a change in runoff during the different seasons is closely related to droughts and flooding in this region (Bae et al., 2008). Therefore, this study attempts to understand how the meteorological and hydrological variables are projected to change during the dry season (from October to March) and wet season (From July to September) in the 5 large basins of South Korea using a CMIP5 climate model and two RCP scenarios.
2. Materials and methods
2.1 Study area
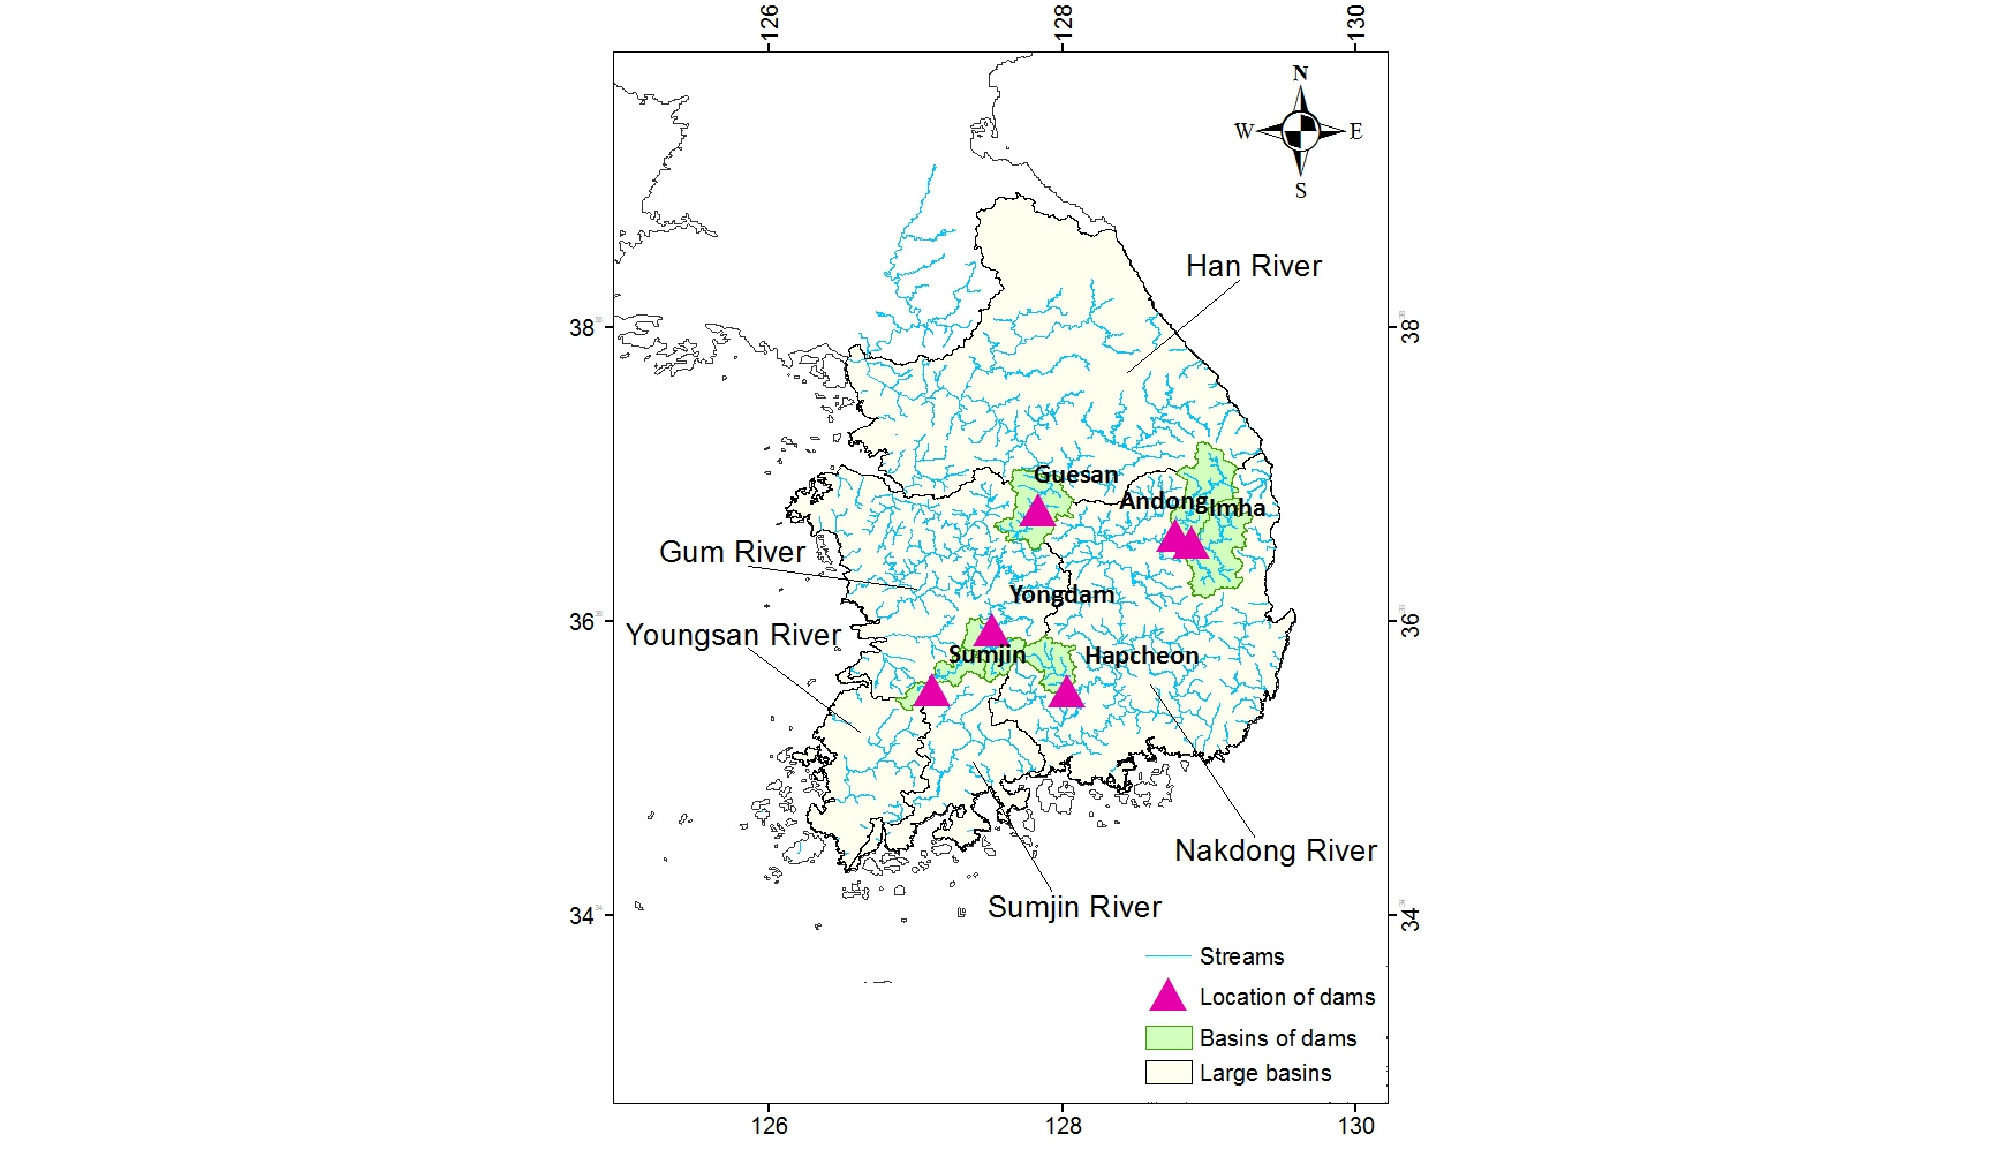
In this study South Korea which is consisted of five large river basins (the Han River, the Nakdong River, the Gum River, the Sumjin River, and the Youngsan River Basins) was considered. The location of 5 large River basins and 6 multi-purpose dams are illustrated in Fig. 1. The climate of South Korea is dominated by various climate and geographic conditions and extreme seasonal variations. The seasonal climate of South Korea affected by the monsoon in summer and Siberian cold weather in winter. The wet season in Korea constitutes around 60% of the annual precipitation from July to September (Bae et al., 2008) which causes the increase the vulnerability of drought during the dry season from October to March (Jung et al., 2013).
2.2 Climate and hydrology data
For this study, daily precipitation data was extracted from the Korea Meteorological Administration (KMA) and The Ministry of Land, Infrastructure and Transport (MOLIT) from 1966 to 2016. Also, the temperature data for the mentioned period, was collected from KMA. Moreover, the observed daily dam inflow data were extracted from the Korean Water Management Information System (WAMIS) for the 6 gauged dam basins during the historical period from 1966 to 2016. The locations of these dams was shown in Fig. 1.
2.3 Hydrological model: PRMS model
The Precipitation-Runoff Modelling System (PRMS) model was developed by USGS to assess the effect of different combinations of precipitation, climate, and land use on streamflow. PRMS is a physical process-based modelling system, deterministic, and distributed-parameter model. This model was originally developed as a single FORTRAN program composed of subroutines, each representing an individual process in the hydrological cycle (Markstrom et al., 2015). Distributed- parameter are provided by dividing a watershed into hydrologic response units (HRUs) based on the physical attributes (e.g. elevation, slope, aspect, land cover, …). In PRMS a water balance and energy balance are computed at each simulation time step for each HRU. The sum of the responses of all HRU's, weighted on a unit-area basis, produces the daily system response and streamflow from the watershed. Partitioning provides the ability to impose land-use or climate changes on parts or all of a watershed, and to evaluate resulting hydrologic impacts on each HRU and on the total watershed. Input variables include descriptive data on the physiography, vegetation, soils, and hydrologic characteristics of each HRU, and on the variation of climate over the watershed. The minimum driving variables required to run in the daily-flow mode are daily precipitation, and maximum and minimum daily air temperatures (Leavesley et al., 1983). The PRMS model use the Hamon method (Hamon, 1961) to compute the potential evapotranspiration.
2.4 PRMS parameters and hydrologic model performance
The long-term runoff analysis by PRMS model needs 105 parameters. The physical parameters of the PRMS model such as area, aspect, slope, elevation, soil type, soil moisture capacity directly obtained for each basin using geographic information system (GIS) by using DEM, land use, land cover, and soil layer maps. The other model parameters were optimized using the observed flow at the six dam catchments, which are associated with linear or non-linear equations to compute surface, subsurface, and groundwater flow. The Rosenbrock scheme which is automatic optimization scheme is used for parameter calibration. The sensitive parameters of PRMS model as explained in Table 1, were applied to the calibration procedure method referring to statistics of long- term observed runoff at six dams up to 2016.
Table 1. Sensitive parameters of the PRMS model
Model calibration is the process of estimating key model parameters by comparing simulated discharge for a given set of assumed conditions with observed discharge for the same conditions. Model validation involves running a model using same parameters determined during the calibration period (Moriaso et al., 2007). In fact, model validation is the process of demonstrating that a model can make sufficiently accurate simulation (Refsgaard, 1997). After calibrating the model parameters with historical observed data, the model performance was evaluated for verification period. To evaluate the uncertainty of hydrologic model parameter estimation, Correlation Coefficient (r), Root Mean Square Error (RMSE), Nash–Sutcliffe Efficiency (NSE), and Percent Bias (PB) were considered and defined as the following Equations:
| $$r=\frac{\Sigma\left(Q_{obs}-\overline{Q_{obs}}\right)\left(Q_{sim}-\overline{Q_{sim}}\right)}{\sqrt{\Sigma\left(Q_{obs}-\overline{Q_{obs}}\right)^2\left(Q_{sim}-\overline{Q_{sim}}\right)^2}}$$ | (1) |
| $$RMSE=\sqrt{\frac{\Sigma\left(Q_{obs}-\overline{Q_{sim}}\right)^2}n}$$ | (2) |
| $$NSE=1-\frac{\Sigma\left(Q_{obs}-Q_{sim}\right)^2}{\Sigma\left(Q_{obs}-\overline{Q_{obs}}\right)^2}$$ | (3) |
| $$PB=\frac{\Sigma Q_{sim}-\Sigma Q_{obs}}{\Sigma Q_{obs}}\times100(\%)$$ | (4) |
where, is observed flow, is simulated flow, is the average of observed flow, is the average of simulated flow, and n is a number of data.
After the selection the optimized model parameters, these optimal parameters were applied to project the future runoff in the 5 large River basins in South Korea.
2.5 GCMs downscaled data
In the present study, we use one CMIP5 GCM scenario with two RCPs (RCP4.5 and RCP8.5) for projecting future changes of Korean River basins. The procedure for selecting one representative CMIP5 scenario from 26 GCMs is described as follow:
Firstly, 26 GCMs of CMIP5 scenarios with different resolutions were used to provide daily meteorological data under the same initial conditions with two RCPs (RCP 4.5 and RCP 8.5). However, the resolutions of these climate change projections from GCMs are too coarse for local watershed assessment. As a result, downscaling is needed for adjusting the global signals to regional scale. Recently, model output statistic (MOS)-based methods have been used to downscale GCM output at local scales, like bias-correction/spatial disaggregation (BCSD). Therefore, 26 sets of GCM scenarios were downscaled over 60 stations in South Korea using three different bias-correction techniques, called Spatial Disaggregation Quantile Mapping (SDQM), Spatial Disaggregation Detrended Quantile Mapping (SDDQM), and Spatial Disaggregation Quantile Delta Mapping (SDQDM). More information about these procedures are explained in Cannon et al. (2015) and Eum and Cannon (2017).
Secondly, the performances of the downscaled GCMs in projecting climate signals by 26 CMIP5 GCMs were compared in terms of the ability of model to project the extreme indices for temperature and precipitation, recommended by the World Meteorological Organization’s ETCCDI (Zhang et al., 2011). The results of these comparisons showed that for all climate projections, SDQDM method exhibit better performance to project extreme indices for three different future periods (i.e., 2025s, 2055s, and 2085s). Therefore, among three statistical downscaling methods, SDQDM method was applied to produce downscaled GCMs future projections for stations over South Korea.
Next, to understand which GCM models has the better performance to project future climate data, two-sample Kolmogorov-Smirnov (K-S) test at 10% significance level was used and the distributions of each ETCCDI for GCMs and observations were compared and ranked among the 60 stations in South Korea. 19 GCM models was selected by this method.
Finally, KKZ algorithm (Katsavounidis et al., 1994), which is one of the cluster analysis techniques was used to find the optimal GCMs. This method utilizes the sorted pairwise distances for initialization. Based on the results of KKZ method for three different periods and two RCPs, 13 models should be use for multi model ensemble analysis and among them, INMCM4 showed the better performance and has the firs rank among them. Therefore, in this analysis, INMCM4 model was selected to project the future response of streamflow during the dry and wet seasons.
All the procedures to select the best GCM model was done by APEC climate center (APCC), and Climate Change Adaptation for Water resources (CCAW) and the results were reported in CCAW (2017).
2.6 Projecting the future runoff
To analyze the projection of climate and hydrologic variables, the projected time series were divided into three-time slices of thirty years, means 2025s (2011-2040), 2055s (2041-2070), and 2085s (2071-2099), and then average variation of these variables were compared to the reference period (1976-2005) for two separate RCPs (RCP4.5 and RCP8.5). The relative change are calculated as the percentage change (%) for precipitation and streamflow, as well as absolute change for temperature changes for three future periods compared to the reference period.
3. Results and analysis
3.1 Calibration and verification of PRMS model
To provide runoff values that reflect the natural flows, the model was calibrated and verified at six gauging stations referring to the statistics of long-term observed runoff during the period 1966 up to 2016. The location and name of these six dams was shown in Fig. 1. The model calibrated and then verified in two separate periods. The periods of calibration and verification periods was shown in Table 2. To evaluate the accuracy of model, the correlation coefficient (r), the root mean square error (RMSE), the Nash-Sutcliffe efficiency (NSE), and the percent bias (PB) were considered and the results of the performance metrics were shown in Table 3. The r and NSE coefficients revealed the goodness-of-fit between estimated and observed flow, and the NSE coefficient above 0.6 is considered volumetric error, respectively. The PRMS model showed reasonable performance for all statistics during the calibrated period and two verification periods. Table 4 shows the values of optimized sensitive parameters for each dam basins.
Table 2. Calibration and verification periods
Table 3. Statistical analysis of 6 dams in calibration and verification periods
Table 4. Optimized values for model parameters
3.2 Possible changes in precipitation and temperature in dry and wet season
Fig. 2 shows the future climate changes in temperature and precipitation over South Korea under INMCM4 scenarios for RCP 4.5 and RCP8.5 for dry and wet seasons. In both wet and dry seasons and under two RCPs, the absolute changes (℃) of mean annual temperature were consistently projected to increase during the dry and wet seasons. The mean increase of annual temperature for dry season is expected to be +0.19℃ (RCP4.5) to +0.87℃ (RCP8.5) in the 2025s and +1.23℃ (RCP4.5) to +2.61℃ (RCP8.5) in the 2085s. However, this increasement for wet season are projected to be +0.32℃ (RCP4.5) to +0.52℃ (RCP8.5) in the 2025s and +1.31℃ (RCP4.5) to +2.45℃ (RCP8.5) in the 2085s.
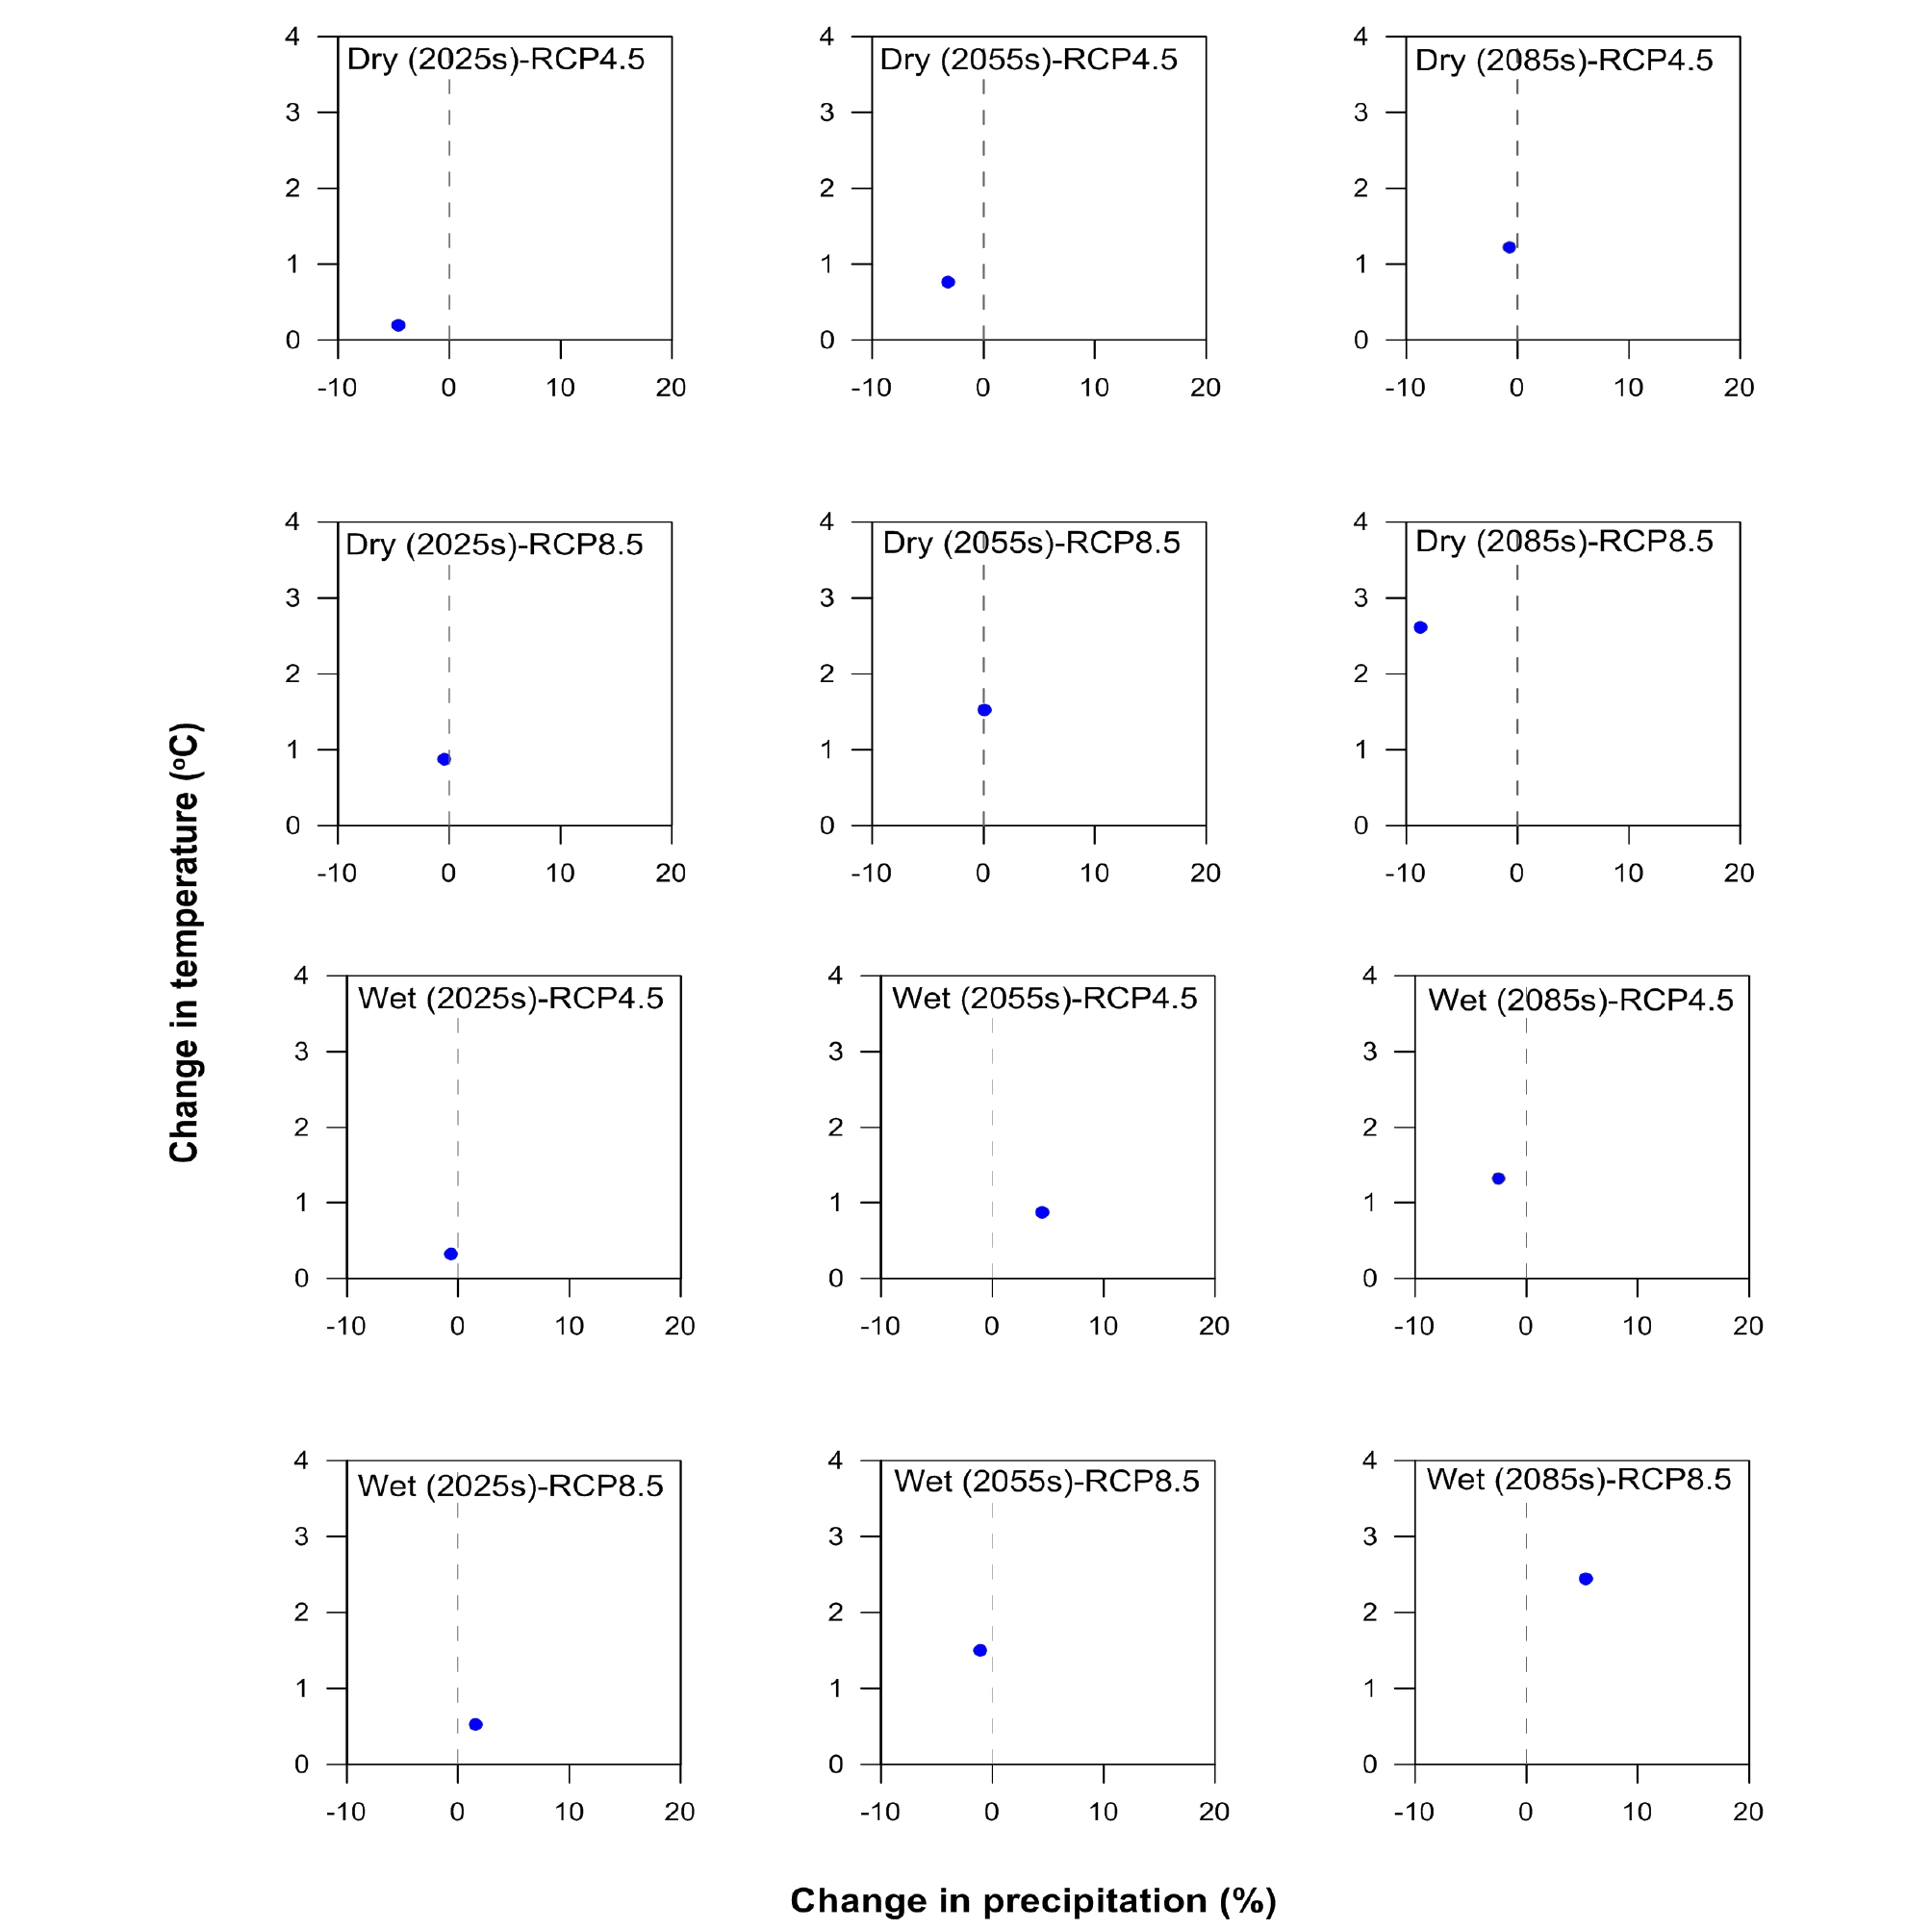
Moreover, the relative change of precipitation during the different periods and RCPs for dry and wet season are shown in Fig. 2. As can be seen, the relative change of mean annual precipitation revealed different patterns from 2025s to 2085s: constant increasing trends for dry season (RCP4.5), increasing then decreasing trends for dry season (RCP8.5) and wet season (RCP4.5), and also decreasing and then increasing trend for wet season (RCP8.5). The comparison between the result of relative change of mean annual precipitation during dry and wet seasons (Fig. 2) showed that there are higher uncertainty in projection of precipitation compared to the temperature during these seasons. Also, this Figure revealed that decreasing in precipitation are higher in dry season than wet season. In addition, under RCP 8.5 the precipitation decreases in 2085s (-8.74%) and increase in wet season (5.30%) for 2085s period compared to the reference period. To better understand how the precipitation is projected during the wet and dry seasons, the spatial distribution of relative change of precipitation during different periods compared to the reference period was prepared and shown in Fig. 3 and Fig. 4 for dry season and wet season, respectively.
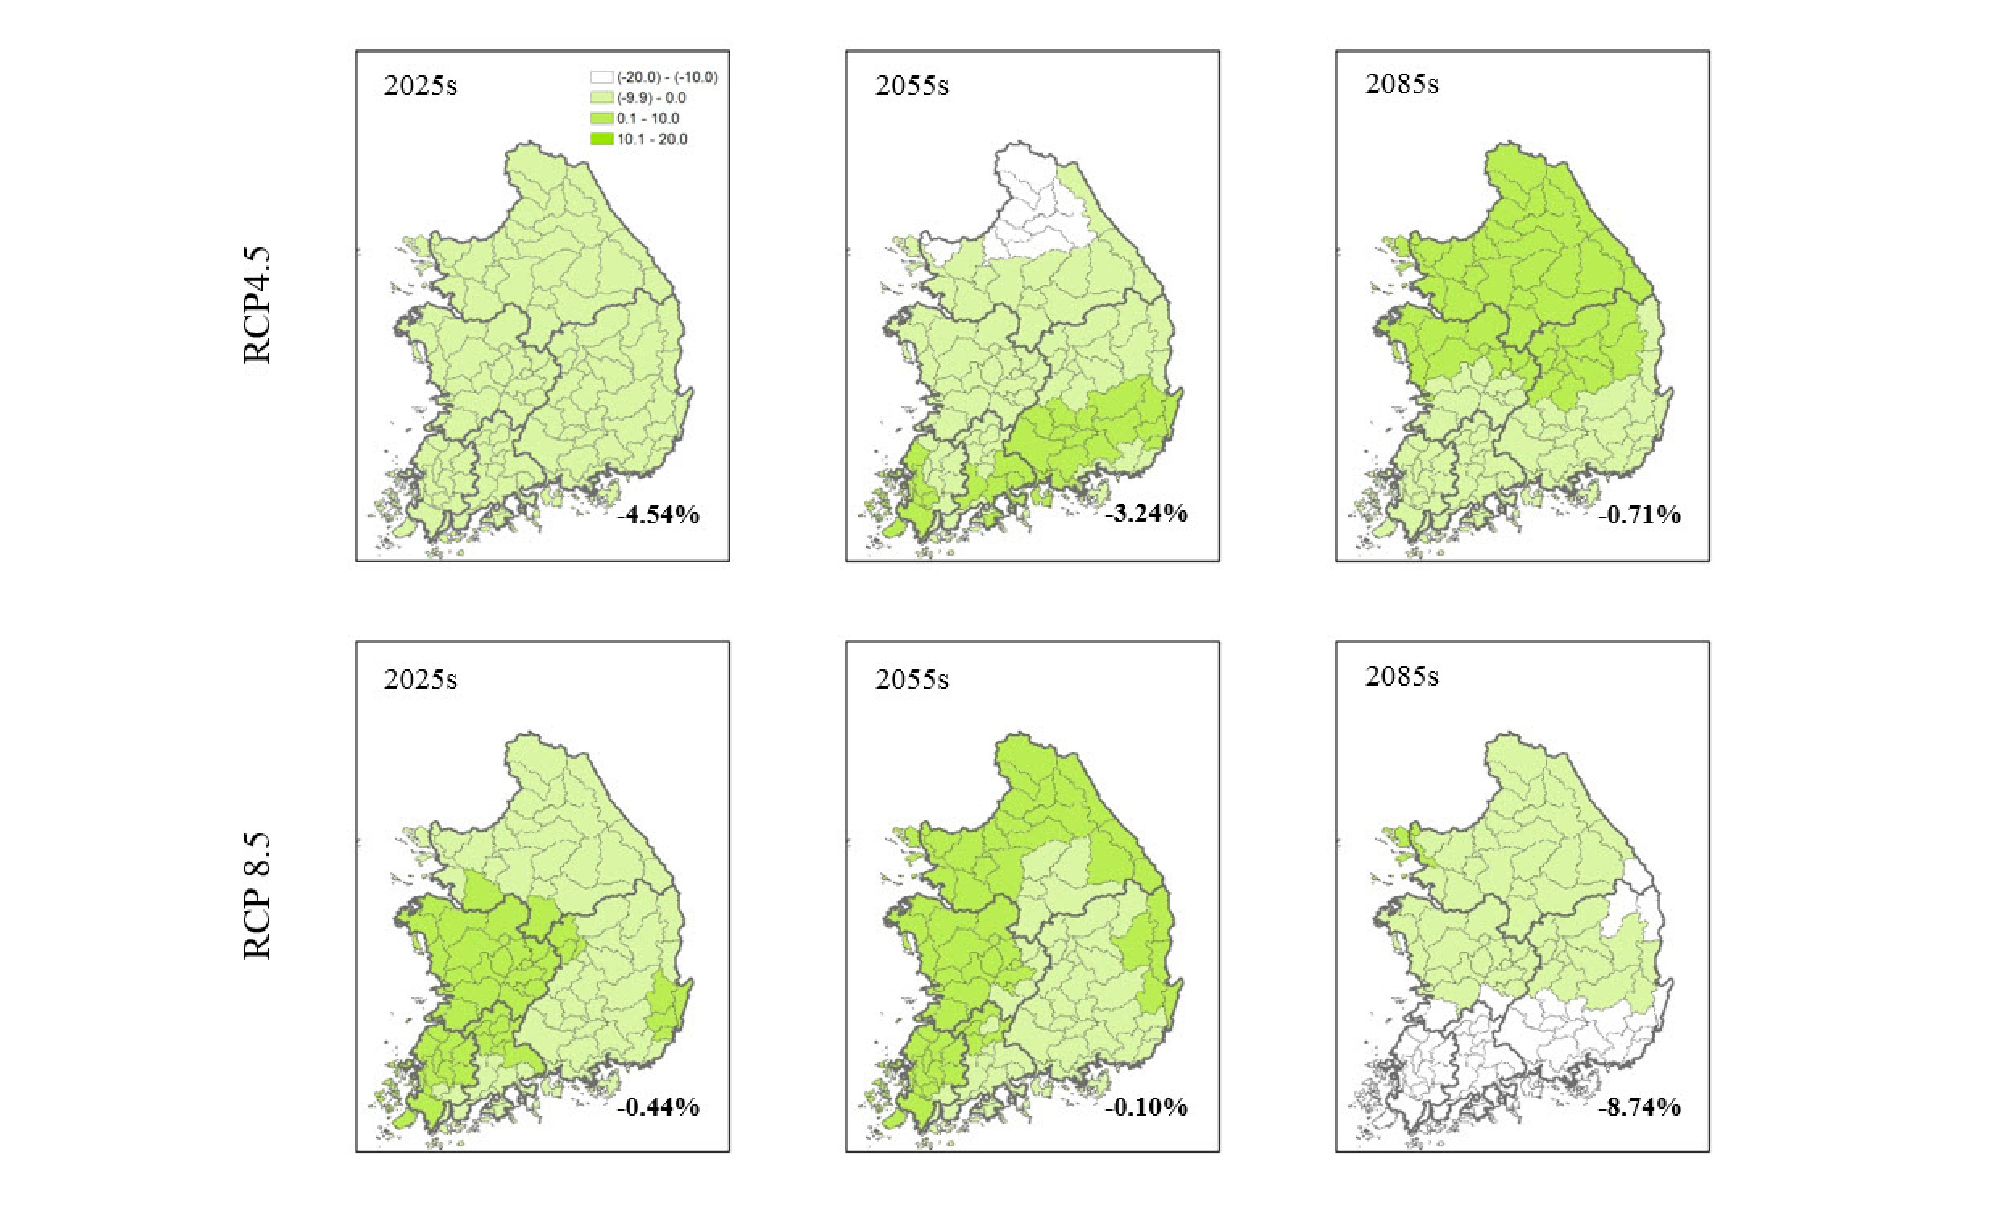
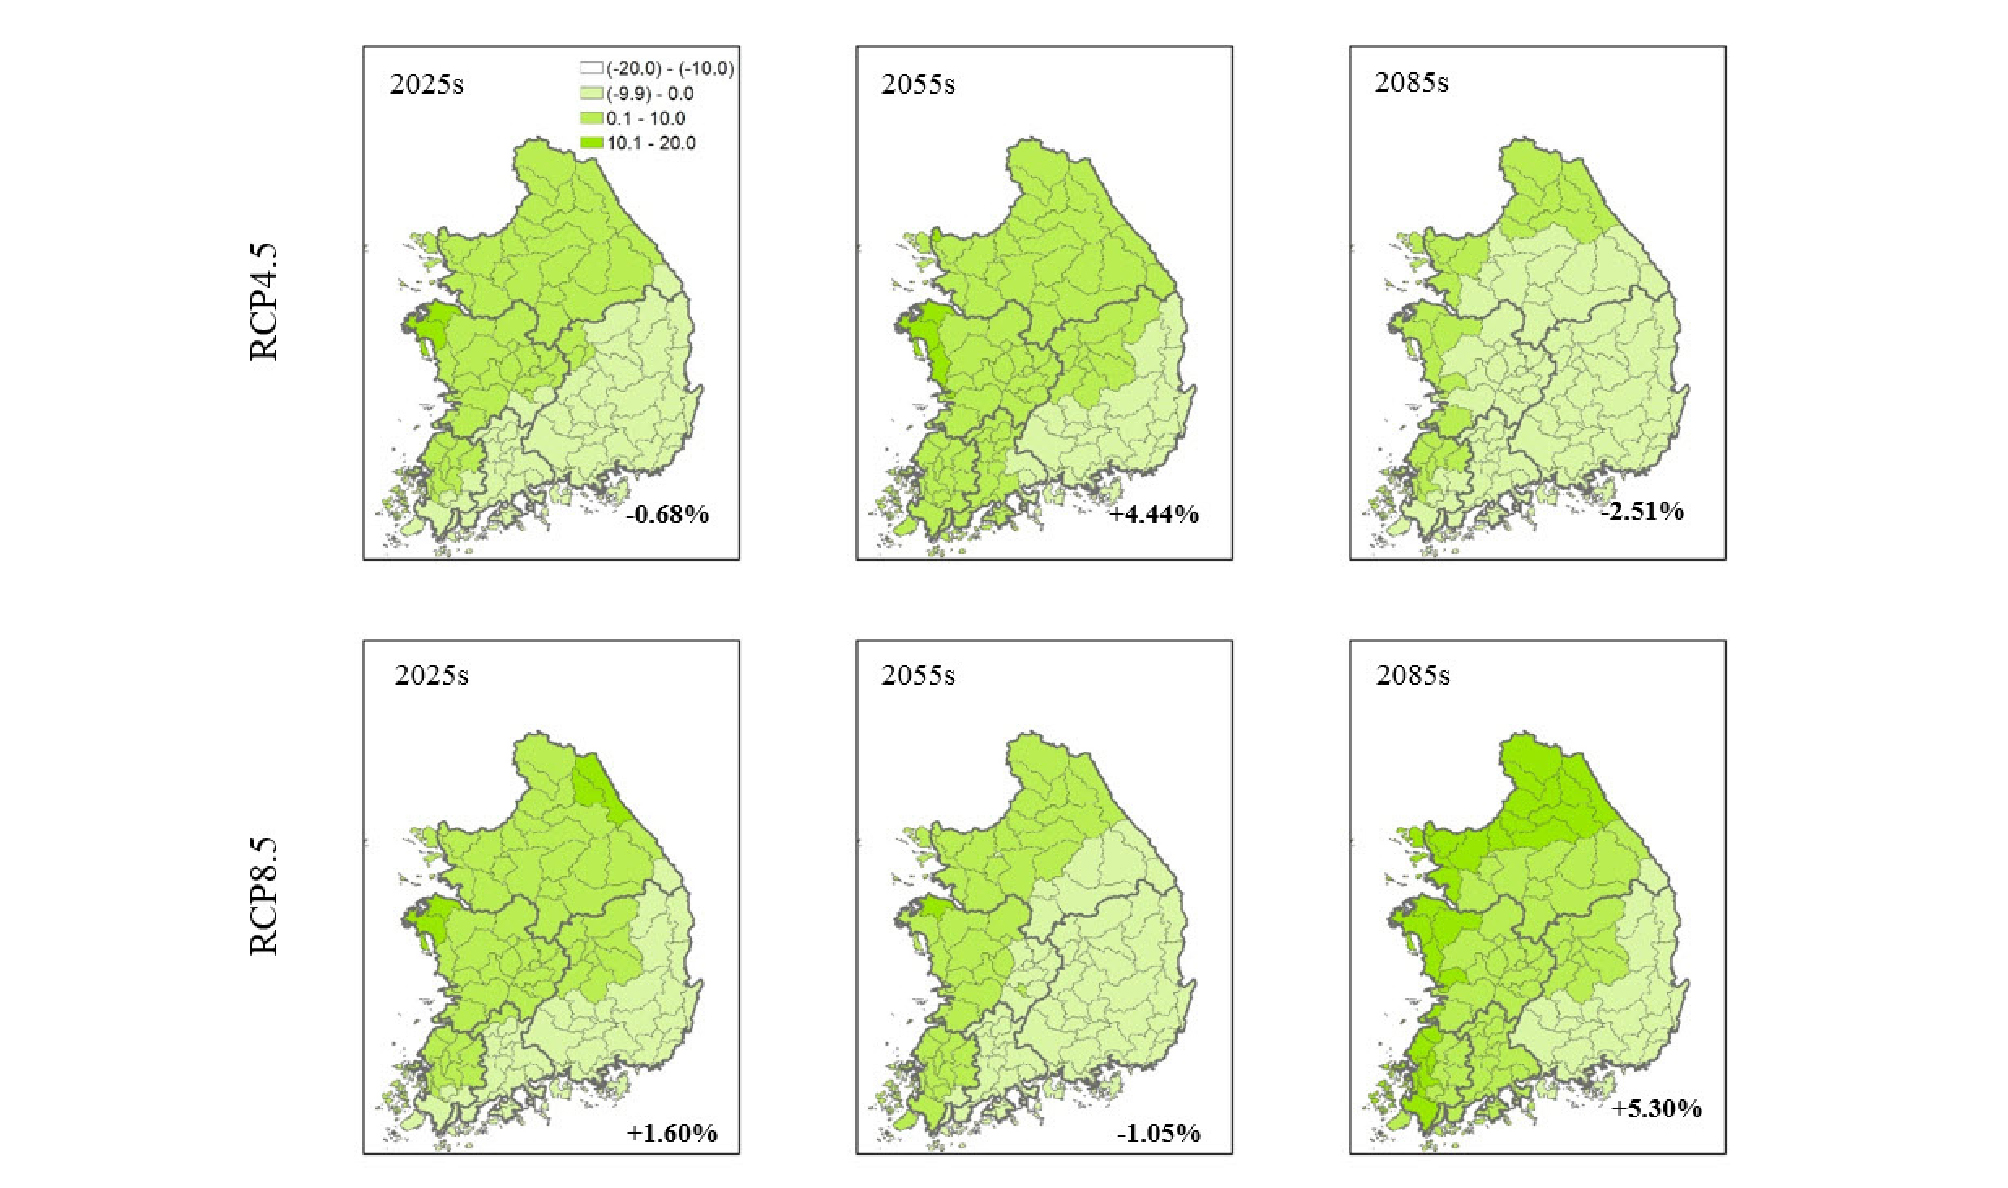
The spatial distribution of relative change of precipitation during the dry season showed that all basins is projected to have different increasing or decreasing change rate during the different periods and RCP scenarios and there is no distinct pattern. In 2025s all basins, in 2055s northern and central part, and in 2085s southern part of Korea is projected to have lower precipitation compared to the reference periods. The mean of relative changes are: -4.54% (-0.44%) in 2025s, -3.24% (-0.10%) in 2055s, and -0.71% (-8.74%) in 2085s for RCP 4.5 (RCP8.5). However, regarding to the wet season (Fig. 4) almost northern and western basins (Han, Gum, and Yongsan River basin) revealed increase in precipitation relative to the reference period, and almost Nakdong River basin projected to decrease precipitation in wet seasons during all periods, and two RCPs.
3.3 Relative changes (%) of actual evapotranspiration during dry and wet season
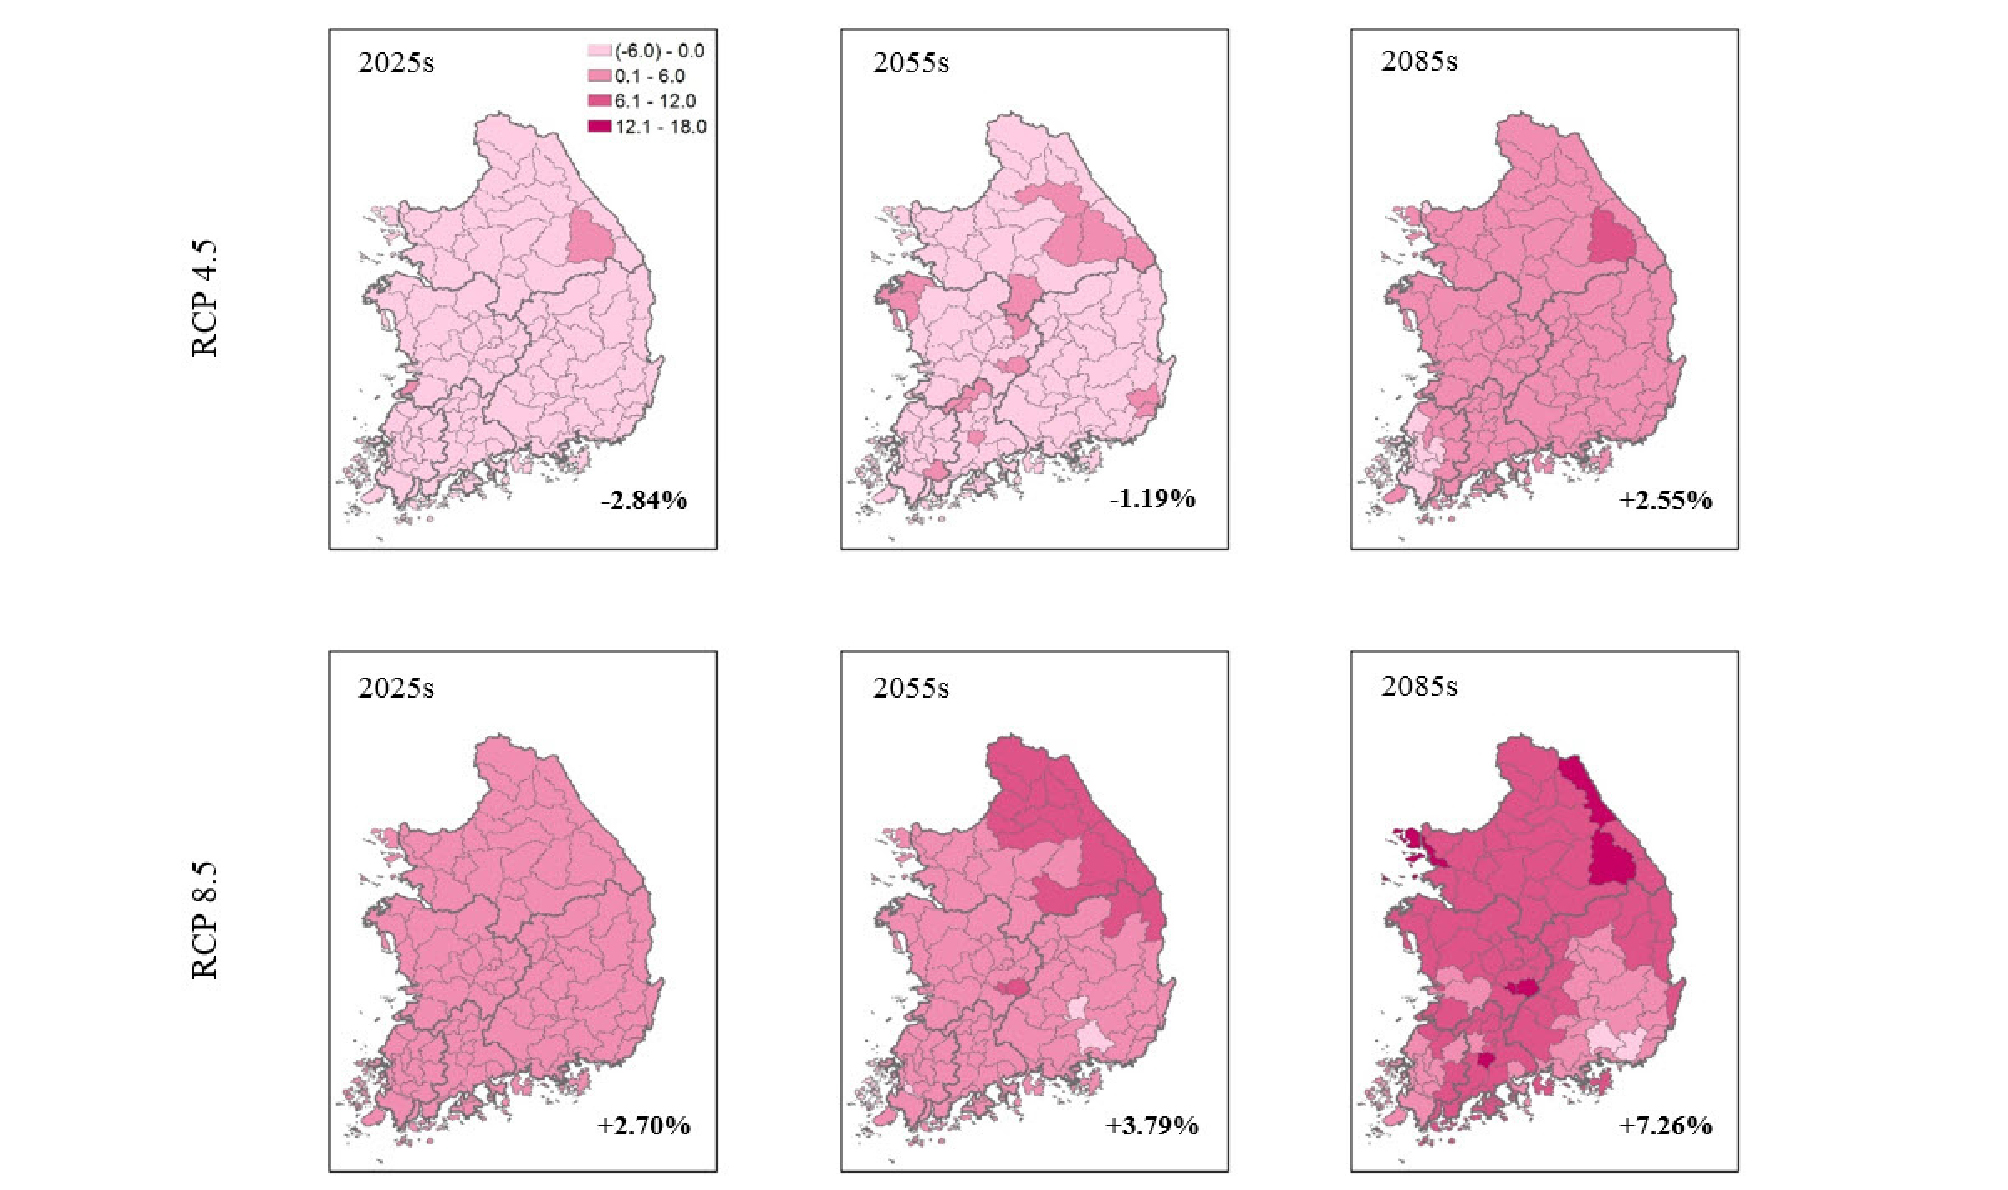
In the present study, the actual evapotranspiration (AET) obtained from potential evapotranspiration (empirical Hamon formulation) multiplied by the rate factor (Hamon coefficient). Fig. 5 and 6 showed the relative change of 2025s, 2055s and 2085s compared to reference period for RCP 4.5 and RCP 8.5 for dry and wet seasons, respectively. During the dry season, the mean annual actual evapotranspiration are projected to decrease for the first two period of RCP 4.5, and then increase by +2.55% for the last period of RCP 4.5. However, in the case of RCP 8.5 there are significant increase in mean annual AET from 2025s period (+2.70%) to 2085s eriod (+7.26%) compared to the reference period. Overall, there are consistent increase in mean annual AET for all basins with higher AET in the northern ans eastern part of the Korea.
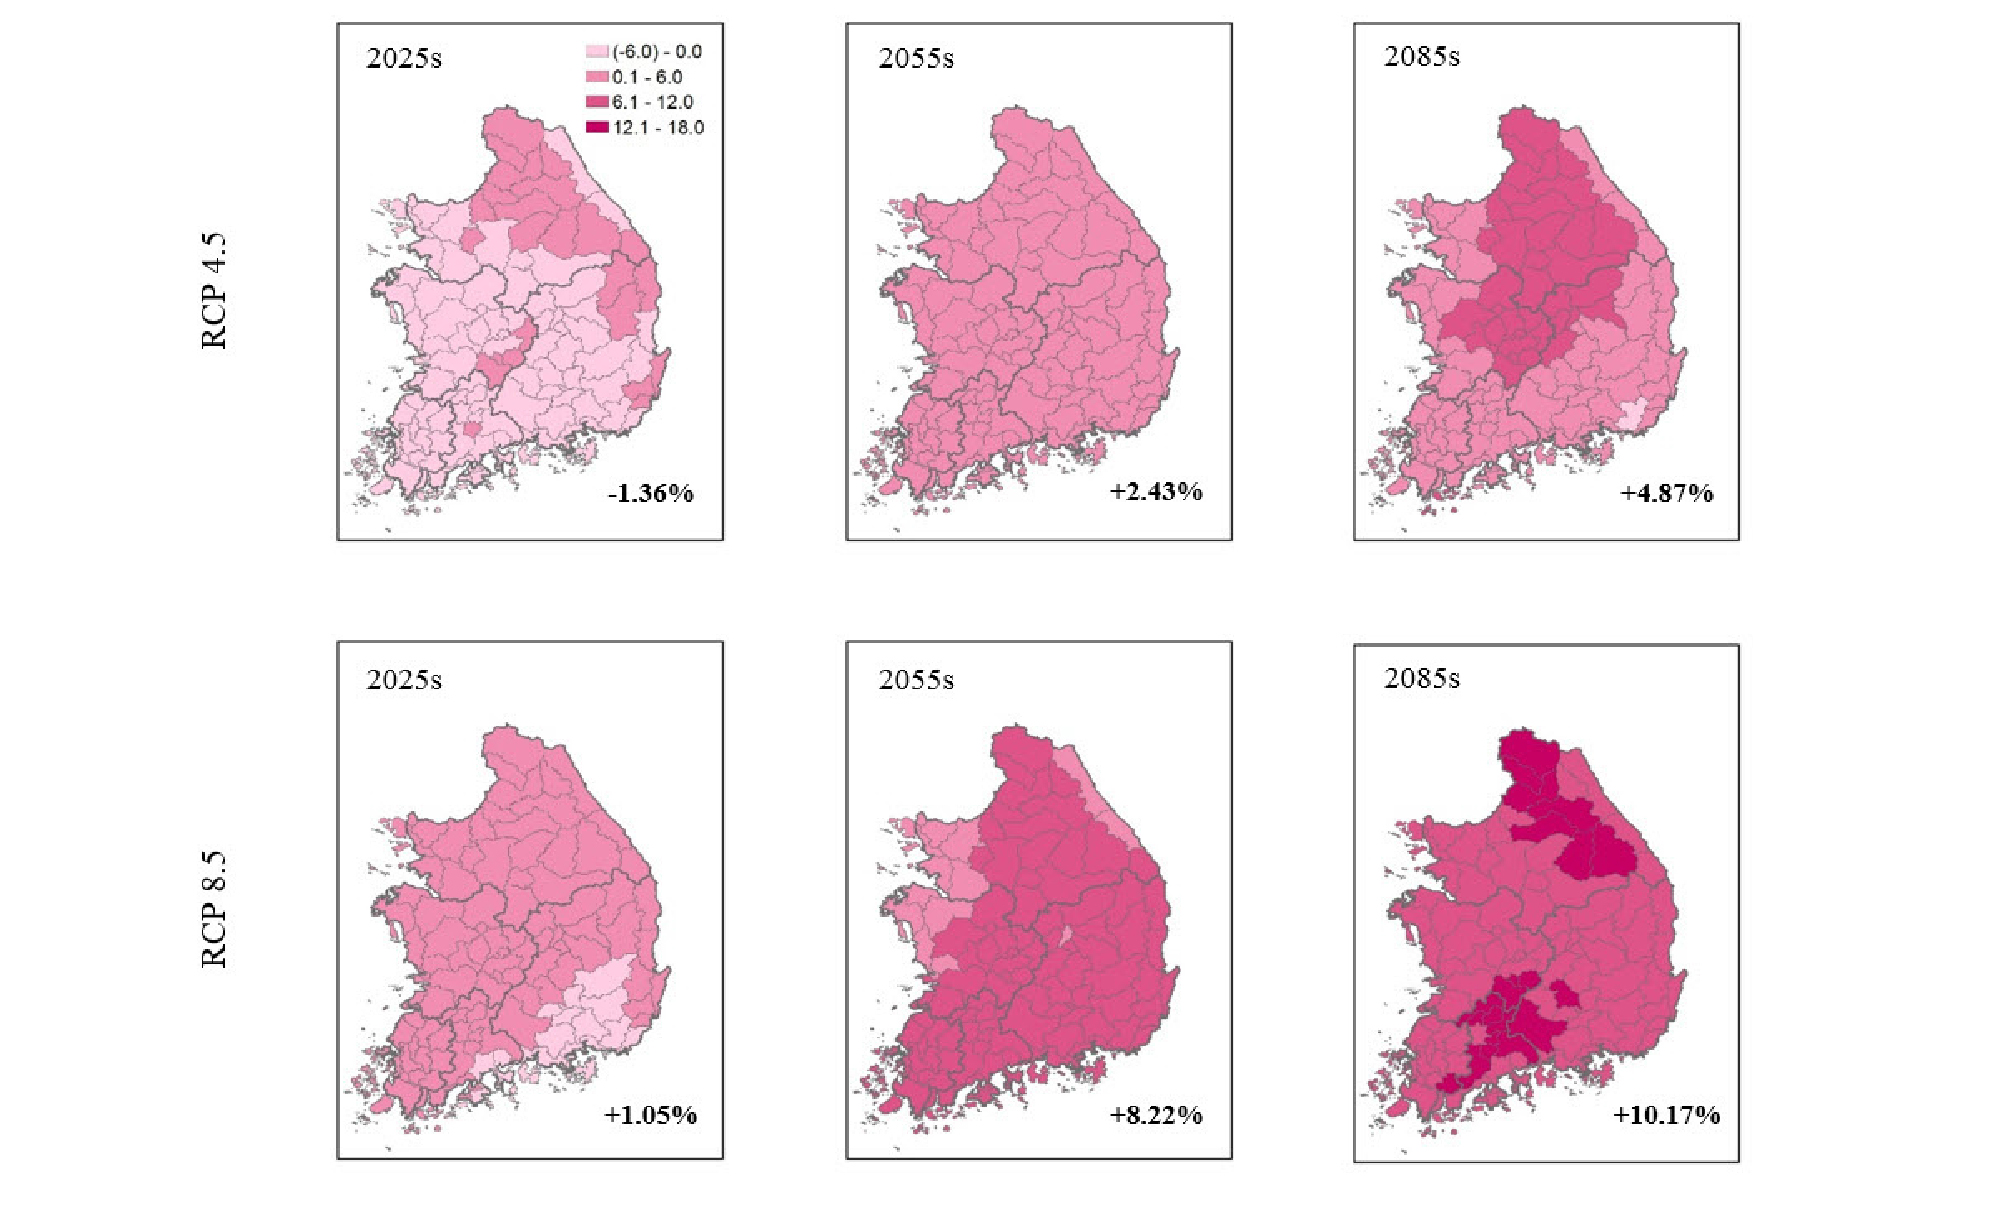
In the case of spatial distribution of mean annual actual evapotranspiration during the wet season, all basins are projected to increase change rate compared to the reference period for all periods and both RCPs, except for RCP 4.5 during the 2025s period. The mean annual evapotranspiration are projected to change (–1.36)% and +1.05% in 2025s period, +2.43% and +8.22% in 2055s, and +4.87% and +10.17% in 2085s for RCP4.5 and RCP8.5, respectively.
3.4 Relative changes (%) of streamflow during dry and wet season
Fig. 7 shows the spatial patterns of streamflow for all basins in dry season of three future time-slices with regard to the reference period. Although the average of streamflow during the all periods and RCPs showed the decreasing trends compared to the reference period, the average of streamflow is expected to increase from 2025s to 2085s for RCP 4.5 (from -7.23% in 2025s to -3.24% in 2085s), while it was expected to decrease for RCP 8.5 (from -7.06% in 2025s to -16.51% in 2085s) which revealed that South Korea is projected to severe drought risk under RCP8.5 scenario during the dry season.
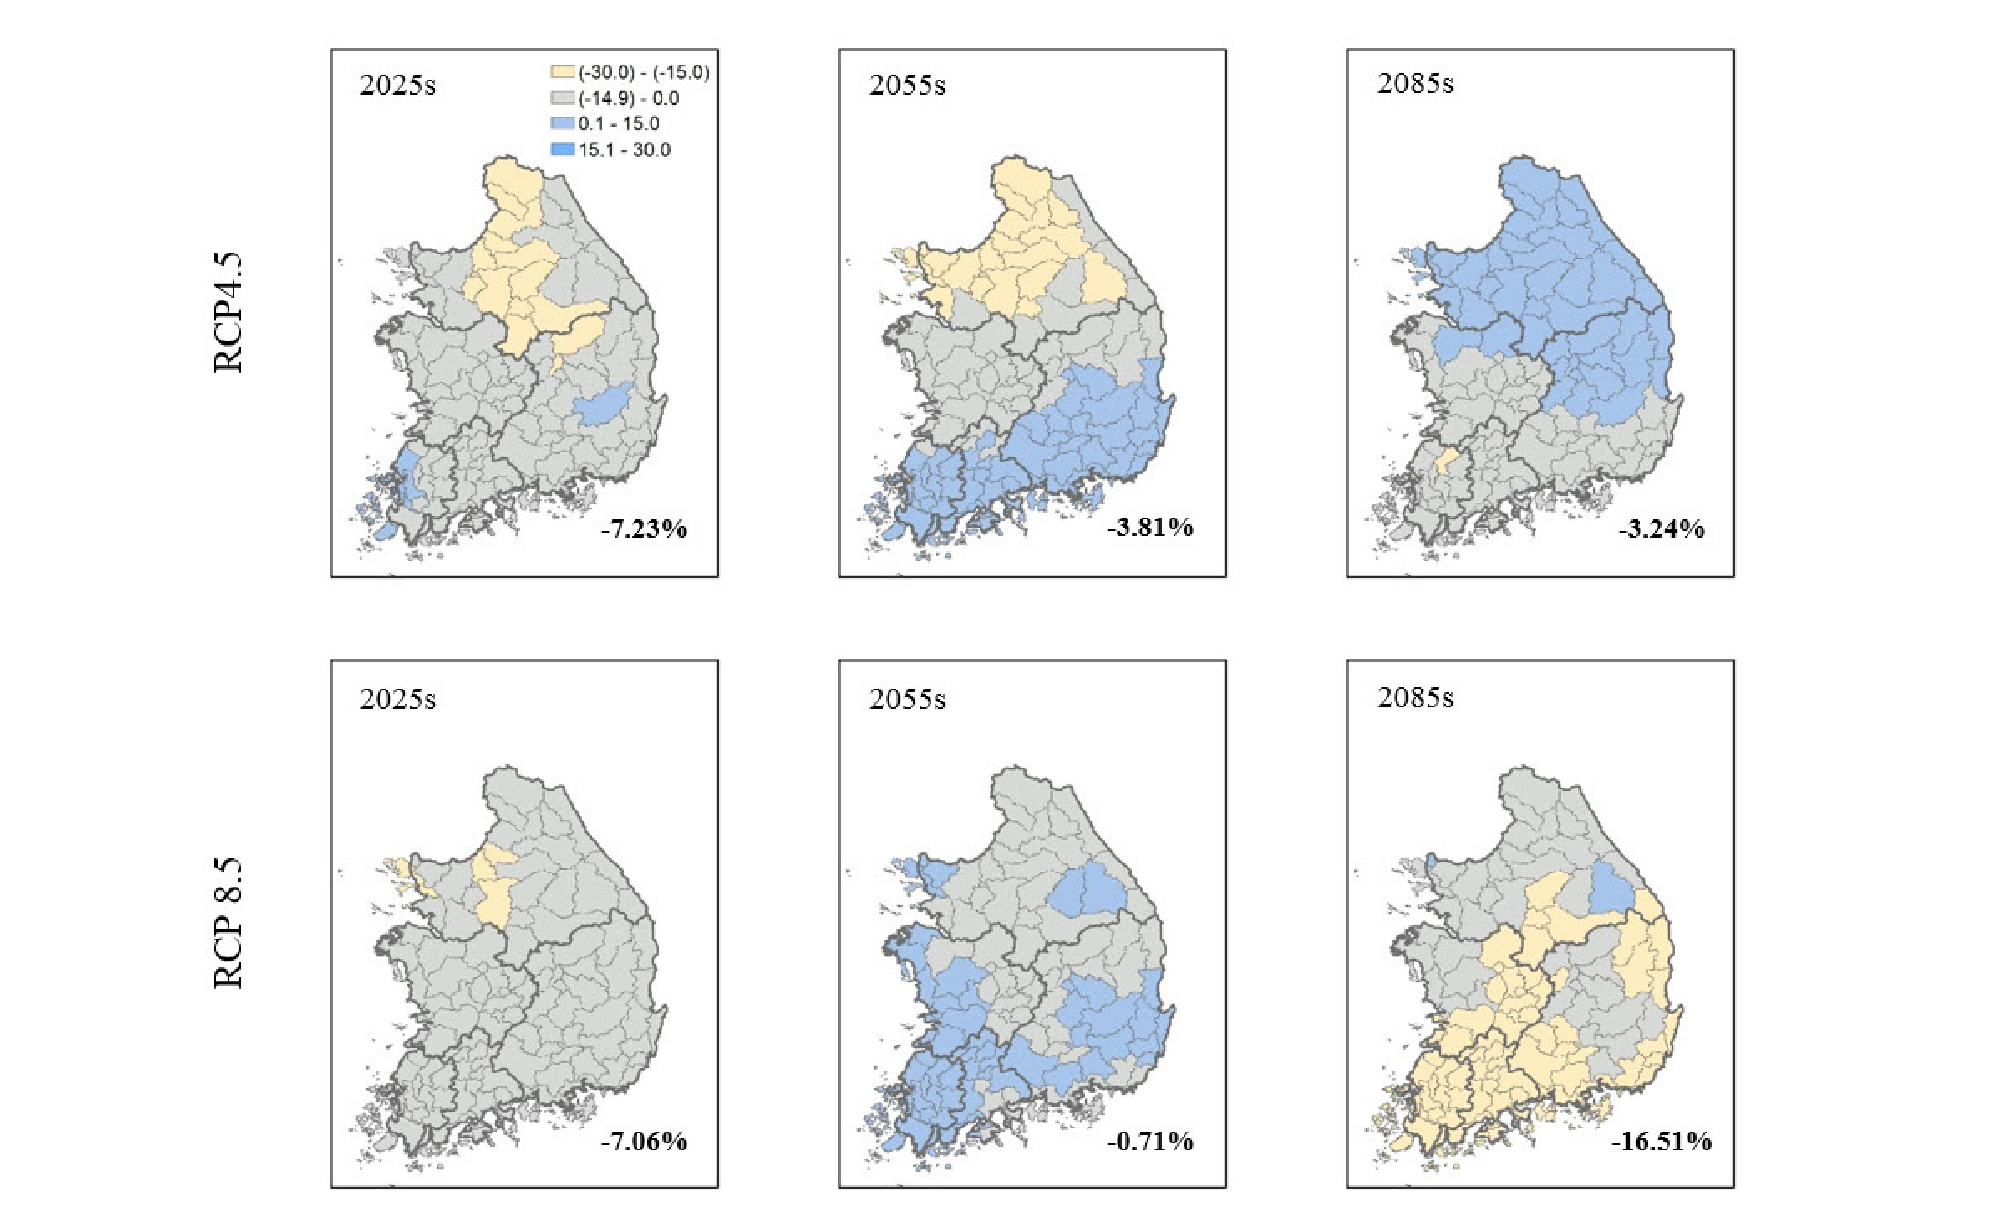
Also, the spatial distribution showed stronger decrease in northern part (Han River basin) in 2025s and 2055s compared to the southern part, which indicated that this region is more vulnerable to drought during these periods compared to the reference period. However, the relative change of the streamflow in Han River and northern part of the Nakdong River basin is projected to increase streamflow (RCP4.5) or smaller decrease streamflow (RCP8.5) in 2085s compare to the southern part.
In general, Northern regions are expected to decrease in seasonal stream flow in 2025s and 2055s and increase in streamflow in 2085s during dry seasons from October to March. Except increase to projected streamflow in 2055s in southern part (Gum, Sumjin, and Yongsan River basin), other two periods (2025s and 2085s) is projected to decrease for RCP4.5 and RCP8.5.
Fig. 8 shows the spatial patterns of streamflow for all basins in wet season for three future time-slices with regard to the reference period. The comparison the results of RCPs for each period showed that the northern and western part of Korea is expected to increase streamflow during the wet seasons, however, the southern and especially southeastern part is projected to decrease in streamflow for three time slices and two RCPs.
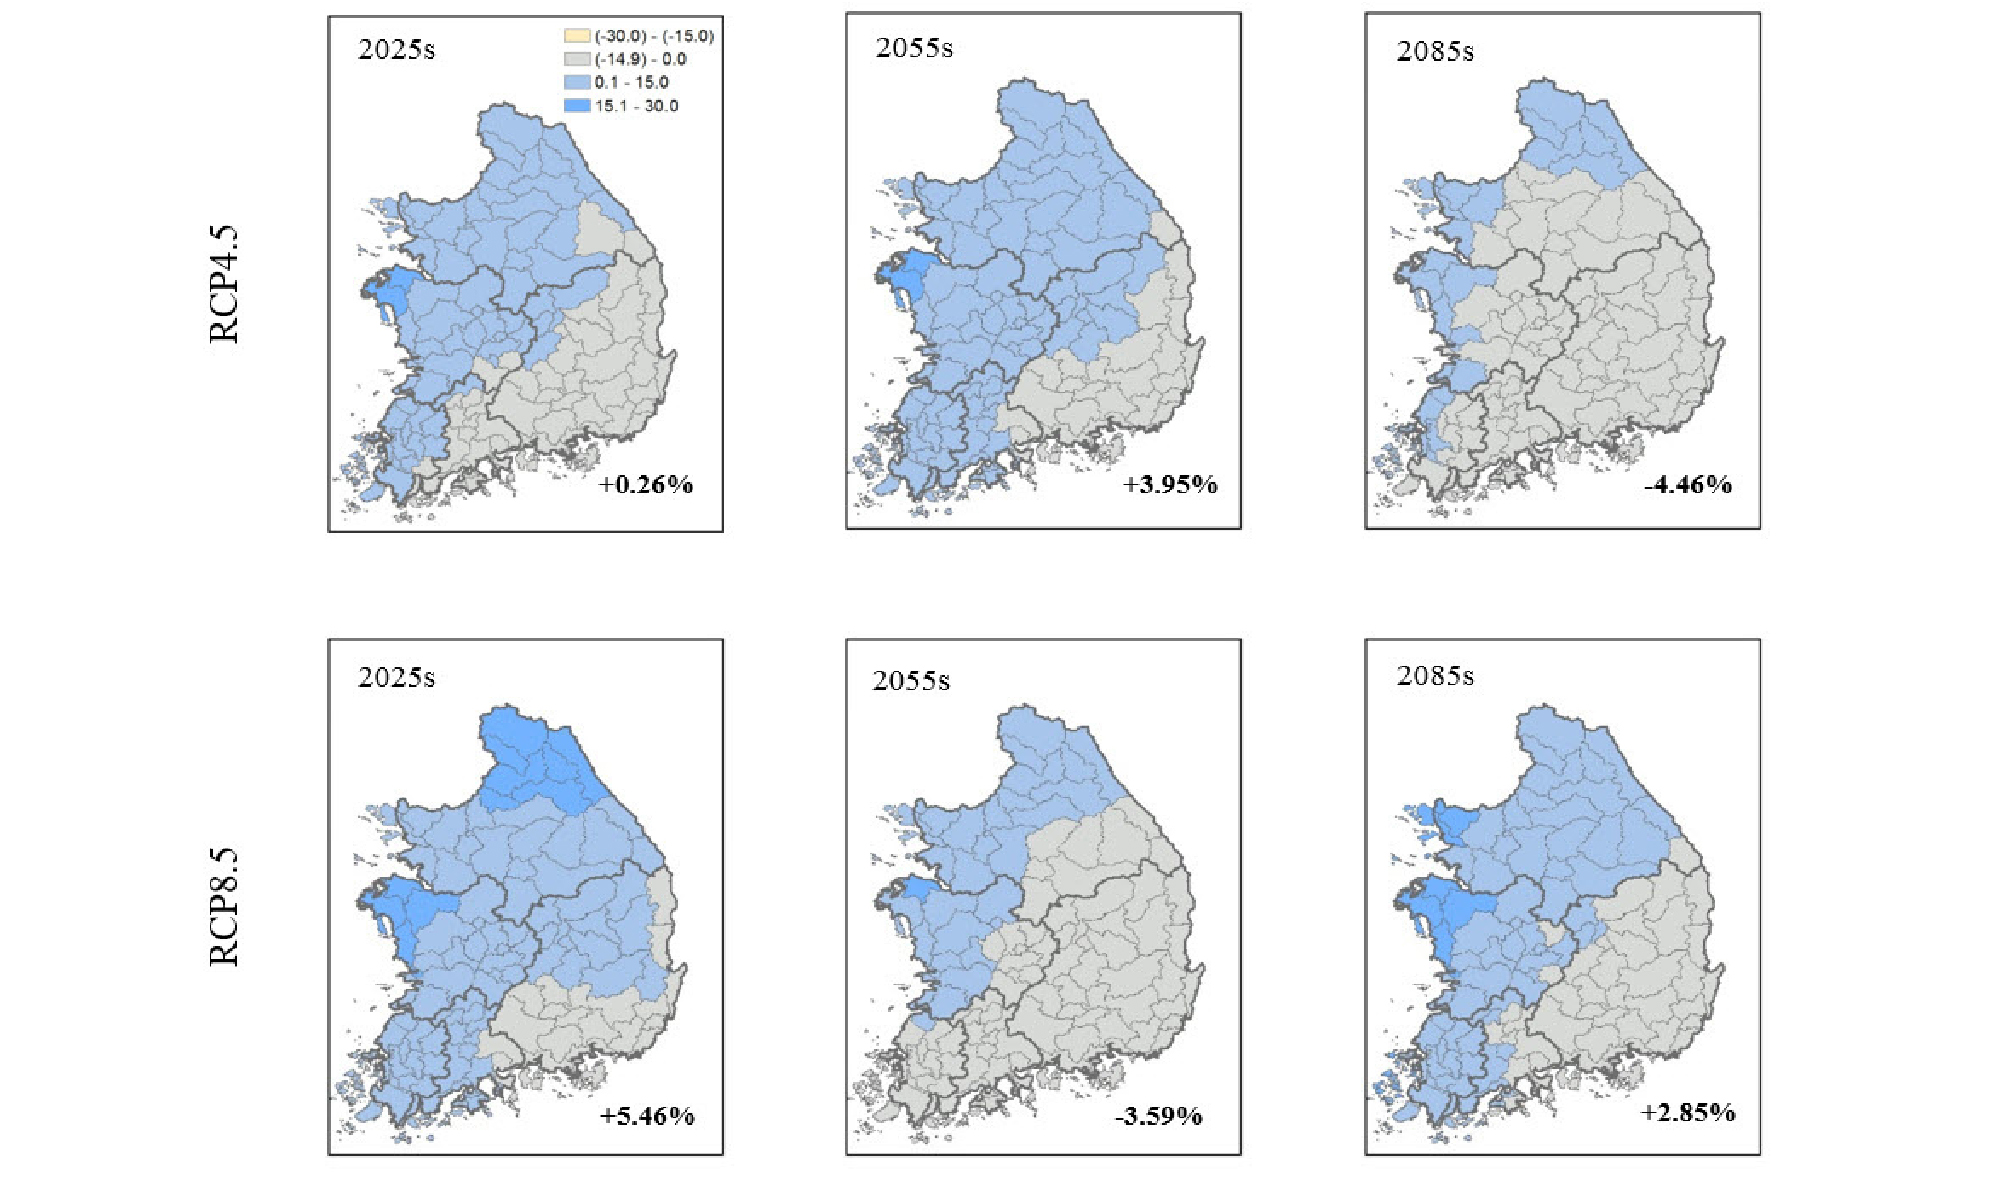
Moreover, the spatial changes of wet seasonal flow has different tendencies during the twenty first century under two RCPs. Regrading to RCP4.5, the increase in wet seasonal streamflow increases from 2025s to 2055s period (from +0.26% to +3.95%), then it decreases for 2085s (-4.46%). Furthermore, the average of streamflow for RCP 8.5 is expected to fluctuate during the periods from increasing in 2025s (+5.46%), decreasing in 2055s (-3.59%), and then increase for 2085s (+2.85%). However, almost all basins of Nakong River basin during all periods and RCP scenarios is expected to have lower streamflow compared to the reference period.
4. Discussions
The assessments conducted by the Intergovernmental Panel on Climate Change (IPCC) showed that an anthropogenic forcing has the significant impact to climate changes. Burning fossil fuels, which cause to variations in the concentrations of carbon dioxide in the atmosphere; variations in the concentrations of the trace gases which adjust the concentration of atmospheric ozone; deforestation, which results in albedo variations and desertification; and many other factors, qualifies as anthropogenic forcing. Also, natural climate changes can significantly contribute to the total climate change pattern (Voldin et al., 2009). Moreover, the interaction between the atmosphere, the land biosphere and the ocean surface layer cause to have different future projections. The results of the future conditions of the basins depends on the scenario that was chosen and the hypothesis to make this scenario (the method for developing the scenario for the emission of greenhouse gases, aerosols, various pollutant in the atmosphere, land use, etc.). In the present study, INMCM4 scenario was used to project the future streamflow during the wet and dry seasons of the Korean River basins.
The results showed that there is consistent increase in the mean annual temperature for all periods compared to the reference period, and this increase in mean annual temperature is higher in RCP 8.5 compared to the RCP4.5 during the wet and dry season.
The spatial distribution of relative change of precipitation during the dry season for INMCM4 scenario showed that all basins is projected to have different increasing or decreasing change rate during the different periods and RCP scenarios and there is no distinct pattern. In 2025s all basins, in 2055s northern and central part, and in 2085s southern part of Korea is projected to have lower precipitation compared to the reference periods. However, regarding to the wet season almost northern and western basins showed increase in precipitation relative to the reference period, and almost Nakdong River basin projected to decrease precipitation in wet seasons during all periods, and two RCPs.
The spatial distribution of streamflow for INMCM4 scenario during the dry season showed that during the 2025s period almost all basin are projected to decrease streamflow comparing to the reference period. Then, for 2055s period, southern regions of Korea is expected to increase the streamflow. Next, for the 2085s period, Han and Northern part of the Nakdong river basin is expected to increase under RCP4.5 scenario and southern region is expected to decrease the streamflow. Moreover, whole Korea in 2085s period under RCP8.5 is projected to decrease streamflow, especially in the southern part. These results indicated that under INMCM4 scenario all basins would likely to be more vulnerable to drought risk in dry season.
Moreover, the spatial patterns of streamflow in wet season showed that under INMCM4 scenario the northern and western part of Korea is expected to increase streamflow, however, the southern and especially southeastern part is projected to decrease in streamflow during the wet season. Nakdong River basin is projected to decrease stream flow for most of the basins during the different periods and two RCPs.
5. Conclusions
This study projects the possibility of decrease or increase in streamflow during the dry (October to March) and wet (July to September) seasons in South Korea under a CMIP5 climate model (INMCM4).
The findings of the present study revealed that under INMCM4 scenario, there are different response to climate change during the dry season. In 2025s all regions are projected to decrease streamflow under both RCPs. In 2055s periods, Han River, and some basins of Nakdong and Gum River basins is susceptible to droughts, while in the southern part increasing in runoff is expected for two RCPs. Regarding to 2085s, Han River basin and northern part of Nakdong and some basins of Gum River are expected to increase in runoff and southern part is projected to decrease in runoff during the RCP 4.5, however, in RCP 8.5 almost all basins are prone to severe droughts. These different patterns in dry seasons primarily affected by unequal distribution of precipitation in Korea during the dry season under INMCM4 scenario.
Additionally, during wet seasons although there is different expanse of basins with increasing relative change compared to the reference period, but in all periods these basins are in western and northern part which shows the regions that are more prone to flood, and southern part specially Nakdong river basin is projected to decrease streamflow during the wet season.
These results follow the robust need for preparation of adaption plan to have sustainable water supply in South Korea to prevention of flood and management the drought during the wet and dry seasons under climate change. However, it should be reminded that these results were obtained by using only one scenario (i.e., INMCM4), and since there is high uncertainty in the results of GCMs, further research should be done by considering the results of multi model ensembles.
