

1. Introduction
2. Materials and Methods
2.1 Study area
2.2 Data preparation
2.3 Monthly average rainfall analysis
2.4 Return period analysis using Gumbel equation
2.5 Probable maximum precipitation (PMP) analysis
2.6 Spatial distribution mapping of extreme rainfall
3. Results
3.1 Average monthly rainfall
3.2 Returns period
3.3 Flood-vulnerable areas based on multiple return period
3.4 Assessing flood vulnerability of agricultural land under different rainfall return periods
3.5 Spatial distribution of PMP and areas classified by vulnerability rank
3.6 Vulnerability of agricultural land to flooding induced by PMP
4. Discussions
5. Conclusions
1. Introduction
Floods are natural hydrological phenomena that occur when land is temporarily inundated due to variations in rainfall intensity, duration, and distribution (Sîli et al., 2020). Although they are a normal part of the water cycle, their impacts are often intensified by human activities and inadequate drainage systems. When excess water accumulates in rivers and croplands, it leads to crop submergence, soil degradation, and substantial agricultural losses (Prakash et al., 2023). Increasing irregularity in rainfall and the rising frequency of extreme rainfall events further heighten these risks, reducing productivity through prolonged waterlogging. Understanding their frequency, magnitude, and spatial patterns is essential for effective management and mitigation (Chau et al., 2013).
Flood damage assessment plays a fundamental role in flood risk management. However, most existing studies have focused on residential, industrial, and urban infrastructure sectors, while agricultural impacts have received limited attention. Floods in agricultural regions not only destroy standing crops but also damage farm structures, machinery, and soils, leading to reduced yields and increased recovery and replanting costs (Dutta et al., 2003). Despite the agricultural sector’s critical importance—particularly in developing Asian countries—it remains undervalued in flood risk assessments (Brémond et al., 2013). Addressing this gap requires flood-damage models specifically tailored to agricultural conditions, supported by reliable data collection and improved validation. Such approaches are increasingly vital as climate change continues to intensify flood frequency and expand the exposure of agricultural land (Hattermann et al., 2014).
Irrigation and drainage systems play a vital role in stabilizing agricultural production by regulating hydrological fluctuations. Historically, these systems have helped farmers adapt to climate variability; however, the increasing intensity of extreme rainfall events now challenges their design capacities. Recognizing these emerging threats, the International Commission on Irrigation and Drainage (ICID) has emphasized the role of efficient irrigation and drainage systems in supporting climate change adaptation and sustainable agriculture (Watanabe et al., 2018).
The design of hydraulic and agricultural drainage systems is typically guided by rainfall return periods that define acceptable risk levels (Martel et al., 2021). Efficient drainage is essential to manage excess rainfall, maintain soil quality, and sustain crop productivity (Ghate and Timbadiya, 2023). However, design standards vary across regions depending on crop type, climatic conditions, and tolerance to inundation. For example, in the United States, systems are designed for 48-hour rainfall events with a 2- to 5-year return period, while in Australia, sugarcane fields follow a 72-hour, 3-year standard. Similarly, Malaysia and India use design return periods of around five years, reflecting local environmental and agricultural needs.
In South Korea, standards for agricultural drainage were first introduced in 1970 and revised in 1983, 2001, 2012, and 2018 (Kim et al., 2014). Major updates expanded the rainfall duration from one to two days and introduced random-duration, 48-hour design rainfall criteria. The most recent standards define a 20-year return period for rice paddies and a 30-year period for horticultural crops. Despite these improvements, frequent farmland flooding continues to cause substantial economic losses, indicating that current systems are insufficient to cope with recent rainfall extremes (Kim et al., 2021). In response, the Korean Design Standards for Agricultural Drainage were comprehensively revised to modernize Korea’s agricultural drainage framework. Supervised by the Ministry of Agriculture, Food and Rural Affairs (MAFRA) and the Korea Rural Community Corporation (KRC), the 2023 revision strengthens key hydrological and hydraulic design parameters, including updated criteria for design rainfall intensity, frequency (increased from 20 to 30-50 years), and critical rainfall duration to better address extreme precipitation (MAFRA, 2023a). It introduces the modified Huff method for rainfall temporal distribution, the critical duration approach for peak discharge estimation, and refined definitions of allowable ponding depth and inundation time. Furthermore, the revision highlights integrated surface-subsurface drainage planning, economic feasibility evaluation, and maintenance guidelines in alignment with related standards (MAFRA, 2023b; 2023c; 2023d), ensuring climate-resilient and adaptive design practices suited to modern agricultural and environmental challenges (MAFRA, 2023a).
In recent decades, South Korea has experienced a clear intensification of extreme rainfall events, largely driven by climate change. Nationwide analyses reveal a significant rise in both the frequency and intensity of short-duration, high-intensity storms, particularly during the summer monsoon season (Kim et al., 2025). Record-breaking downpours in 2020, 2022, 2023 and 2025 caused severe flooding in both agricultural and urban areas, surpassing the historical design rainfall thresholds used in conventional drainage planning (Earth.Org, 2025; PARK et al., 2021). These trends indicate a transition toward more localized and prolonged heavy precipitation events, challenging the reliability of traditional design standards based on fixed return periods. Therefore, the application of Probable Maximum Precipitation (PMP) has become increasingly vital to capture the upper limit of extreme rainfall potential and ensure adequate safety margins in design. This study analyzes daily extreme rainfall patterns across various return periods and PMP in South Chungcheong Province to identify flood-prone croplands and provide insights for strengthening drainage design criteria. Incorporating PMP-based hydrological standards can enhance the resilience of agricultural drainage systems and support climate-adaptive water management in South Korea.
2. Materials and Methods
2.1 Study area
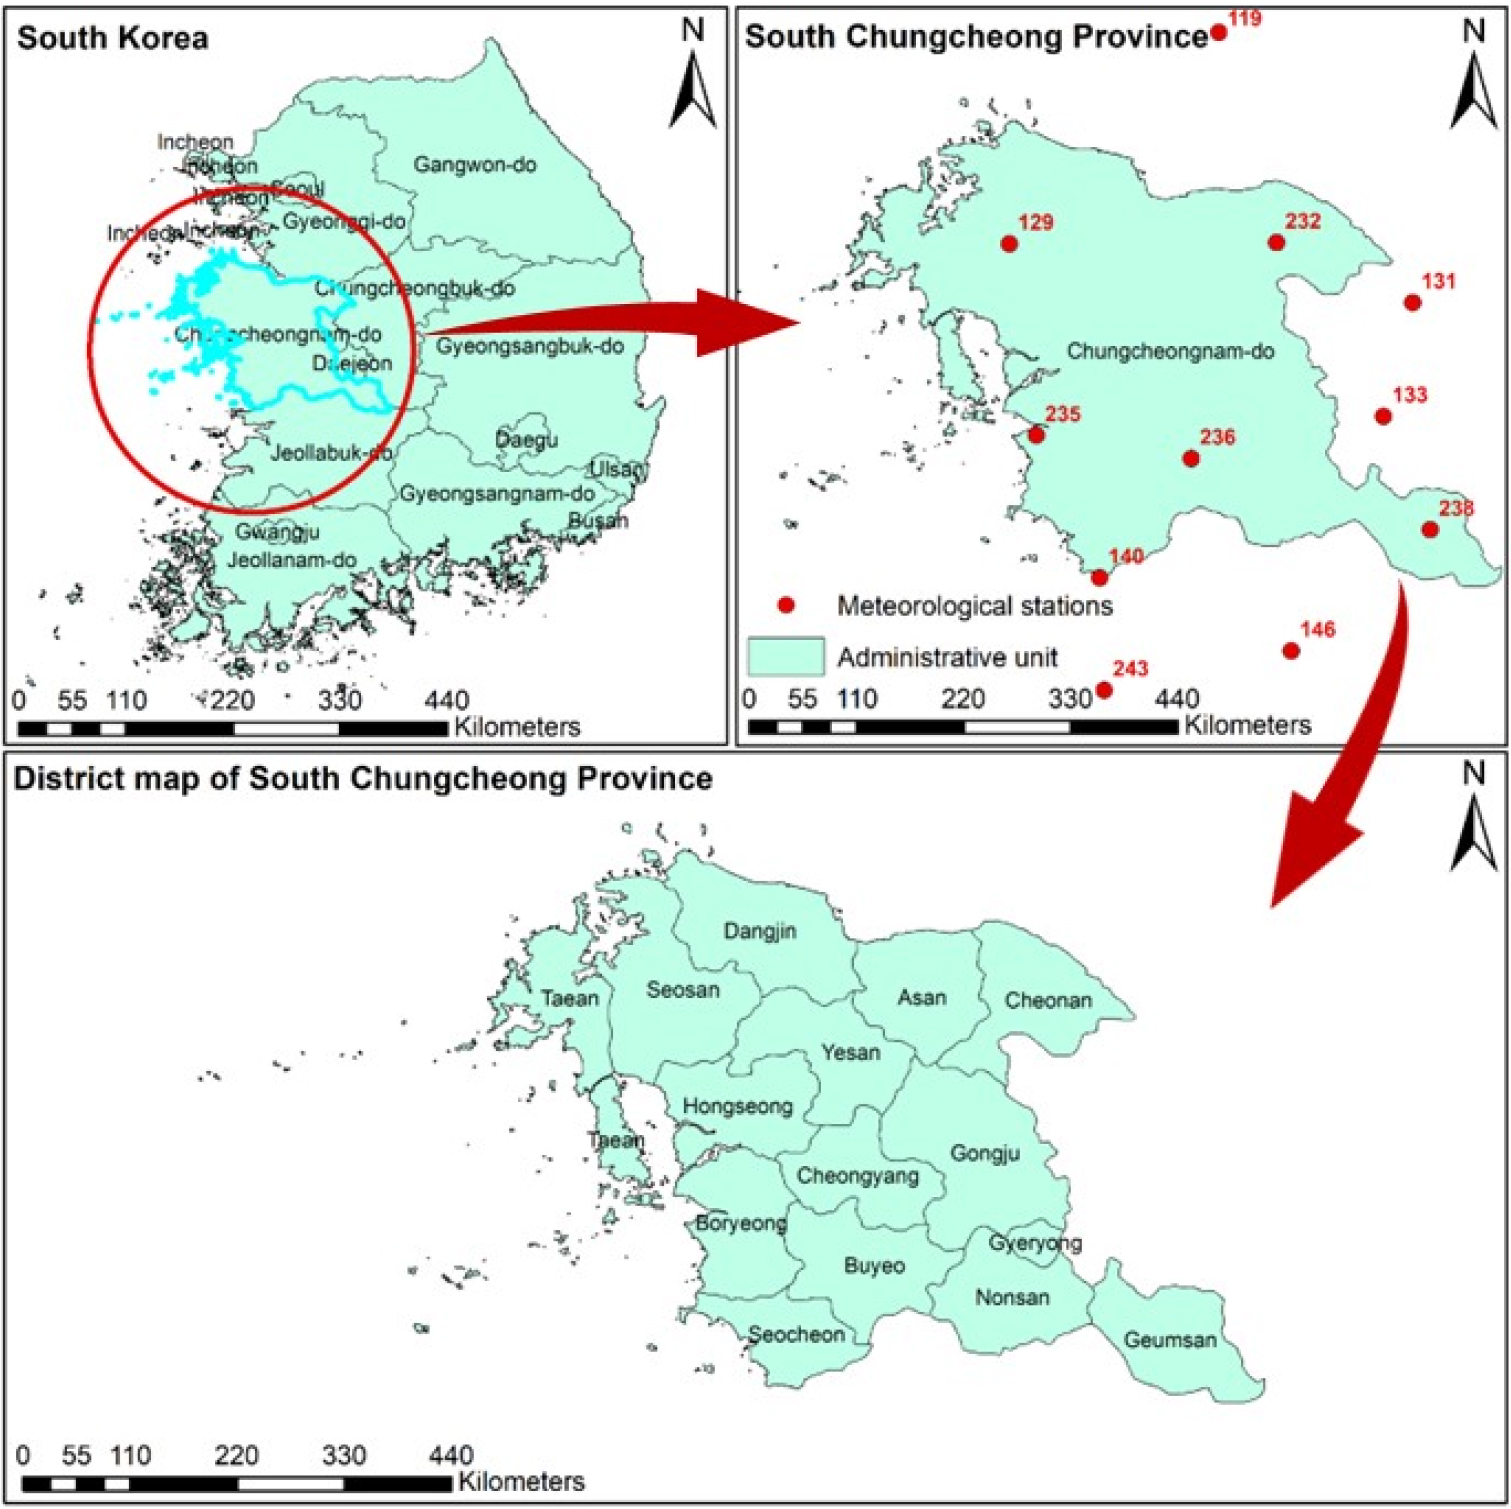
The study area, South Chungcheong Province (Chungcheongnam-do), is situated in the west-central region of South Korea (approximately 36°30’N and 126°45’E) and covers an area of about 8,226 km2. The province exhibits a distinct east-west topographical gradient, with mountainous terrain in the east and low-lying plains toward the west, where approximately 66% of the land lies above 100 m elevation (Kim et al., 2021). Elevation ranges from 3 m to 904 m, influencing spatial rainfall variability and hydrological processes (Jung et al., 2016). The region experiences a temperate monsoon climate with four distinct seasons, an average annual temperature of 11.7°C, and mean annual rainfall of approximately 1,239.7 mm, of which more than 56% occurs in summer, often accompanied by high temperatures up to 31.9°C (Park et al., 2019). These climatic and physiographic conditions, combined with extensive plains, tidal flats, and reclaimed agricultural land, support intensive paddy cultivation, and mixed farming systems, making the province one of Korea’s key agricultural hubs. However, its flat terrain and coastal farmlands also pose drainage challenges during heavy monsoon rainfall, increasing vulnerability to floods and other hydrological extremes (Adelodun et al., 2022). These distinct topographic and agricultural conditions are explicitly considered in this study to ensure that the analysis accurately reflects the region’s specific hydrological and land-use characteristics.
2.2 Data preparation
2.2.1 Observed daily rainfall
Daily rainfall records from 11 rain gauge stations (Fig. 1) covering the period 1973~2024, were obtained from the Department of Hydrology and Meteorology of South Korea through the Meteorological Data Open Portal (KMA, 2025). Missing values in the observed dataset were corrected using the linear interpolation method (Noor et al., 2014).
2.2.2 Land use and land cover (LULC)
For this study, a Land Use and Land Cover (LULC) map for the year 2013 was obtained from the MODIS dataset (Fig. 2), as the 2013 imagery offers the most detailed representation of agricultural areas among the available LULC maps. The map primarily classifies the study area into 15 distinct LULC categories, including forests (evergreen, deciduous, needleleaf evergreen, needleleaf deciduous, and mixed forest), shrubland, herbaceous cover, sparse vegetation, tree-open areas, urban land, bare areas/sand, water bodies, and three agriculture-related classes: cropland, paddy field, and cropland with other vegetation.
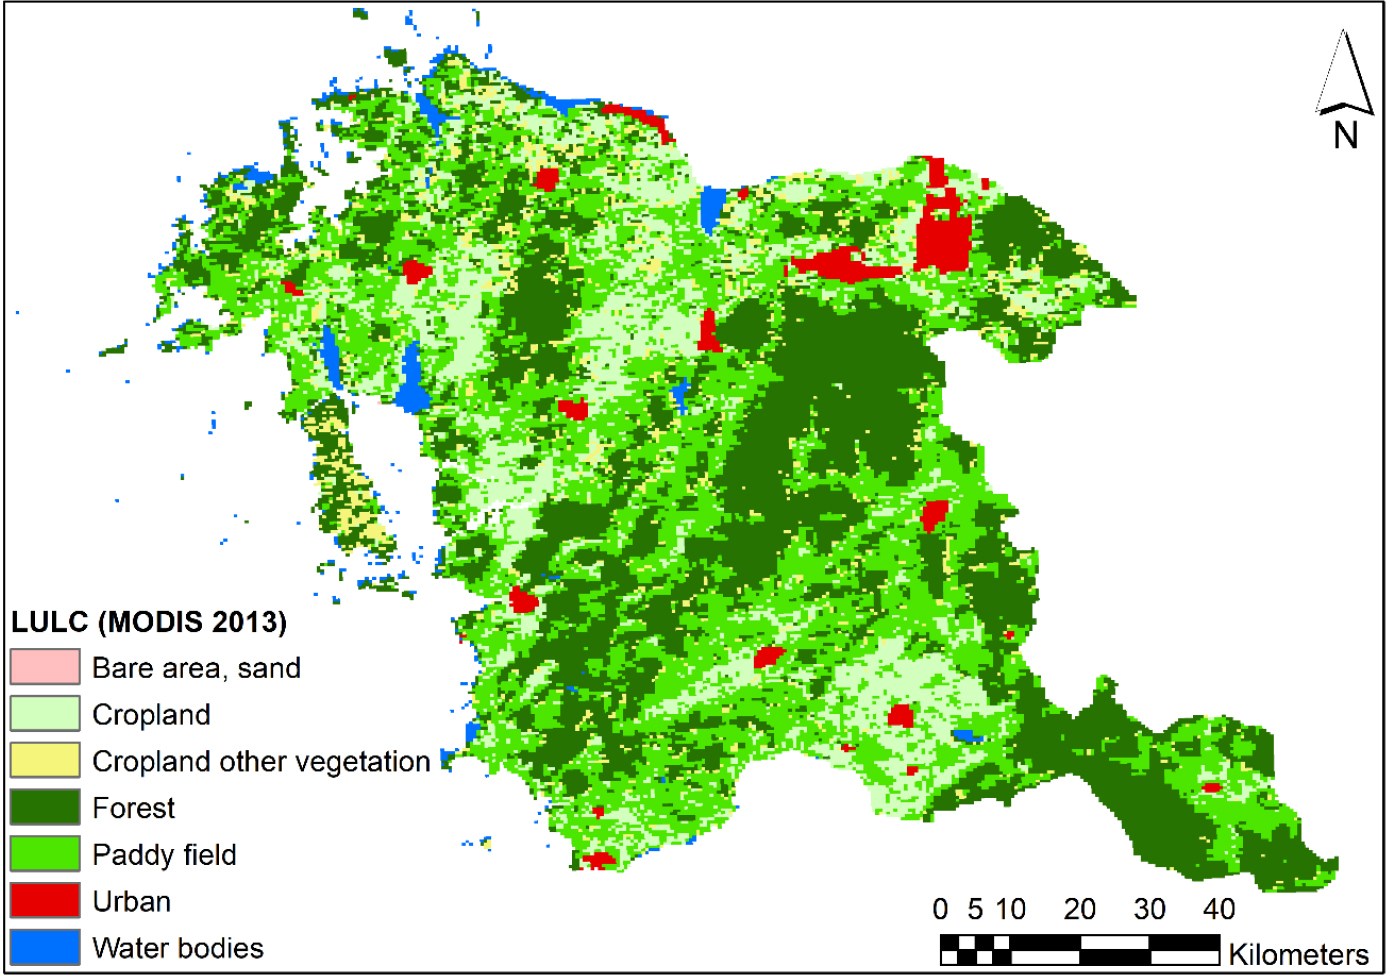
The forest types were merged to create a seven-class LULC map. Among these categories, particular attention was given to the agricultural land classes, as the primary objective of this research was to evaluate and analyze agricultural areas, especially croplands and paddy fields, and cropland other vegetation due to their direct relevance to hydrological processes and vulnerability to climatic extremes. The MODIS-based classification provides a consistent and spatially explicit dataset that supports the identification and quantification of agricultural land use in relation to other land cover types (Othman et al., 2020). Although the LULC is old, the rate of change of crop land from 2009 to 2019 was decreased by 1.3 in overall South Korea which was mostly contributed by the expansion of major cities. The nominal change of land use type in the study area does not highly impact on the result of using land use and land cover map of 2013 for this study. Although the MODIS LULC dataset from 2013, national statistics indicate that cropland area in South Korea decreased by only about 1.3% between 2009 and 2019, primarily due to urban expansion near major cities (ME, 2020). This marginal change suggests that land use patterns in the study area have remained largely stable, and therefore, the use of the 2013 dataset does not significantly affect the reliability of the analysis.
2.3 Monthly average rainfall analysis
To obtain the average monthly rainfall for the study period (1973~2024), a two-step procedure was followed. First, the monthly total rainfall was computed for each year by summing the daily rainfall values within each calendar month. Then, the arithmetic mean was applied across all years to determine a single representative rainfall value for each month, following the general expression (Rhymee et al., 2022):
Where, is the mean rainfall of month m across the entire period
N is the total number of years (1973~2024), and
Pi,m represents the total rainfall of month m in in year i
2.4 Return period analysis using Gumbel equation
The Gumbel extreme value distribution (Gumbel, 1941) is a widely used statistical method for estimating the return periods of extreme rainfall events. In this study, it was applied to daily rainfall data to evaluate extreme rainfall intensities corresponding to different recurrence intervals (T5~T200) shown in table 1. The cumulative probability that the maximum rainfall Q does not exceed a certain value is given by (Osei et al., 2021):
Table 1.
Daily rainfall in different return periods in different observed rainfall station
Where the reduced variate y is expressed as:
Here, T represents the return period in years. The reduced variate y has a linear relationship with the rainfall variable Q and can be expressed as:
Where is the reduced standard deviation and is the reduced mean, both of which depend on the sample size and are available from Gumbel probability tables.
Rearranging, the rainfall magnitude corresponding to a return period T can be estimated as:
Where Qt is the extreme daily rainfall for a return period T, is the mean ofr the annual maximum daily rainfall series, 𝜎 is the standard deviation and K is the frequency factors given as
2.5 Probable maximum precipitation (PMP) analysis
The Probable Maximum Precipitation (PMP) is defined as the greatest depth of rainfall that is physically possible over a given point or specified area for a particular duration at a certain time of the year, under modern meteorological conditions (Sidek et al., 2013). PMP estimates are critical for hydrological design, particularly in the planning and safety evaluation of hydraulic structures such as dams and spillways, where failure risks must be minimized (Chow, 1951). This study uses Hershfield Statistical Method to estimate PMP based on frequency analysis of annual maximum rainfall series. The general hydrologic frequency equation is given as (Sibuea et al., 2021):
Where, XPMP is the probable maximum precipitation, and 𝜎 is the mean and standard deviation of the annual maximum rainfall series, and K is the frequency factor. In this study, a general frequency factor value of K=15 was applied (Sarkar and Maity, 2020).
Among various methods for estimating probable maximum precipitation (PMP), the Hershfield method is considered the most suitable and scientifically balanced for this study. It combines statistical rigor with empirical reliability by using the mean and standard deviation of annual maximum precipitation along with a frequency factor to represent extreme rainfall behavior (Hershfield, 1961). Its advantages include simplicity, minimal data requirements, and adaptability across diverse climatic settings, making it ideal for humid monsoon regions like South Korea. In contrast, purely statistical methods such as Gumbel or Log-Pearson Type III distributions often underestimate PMP because they depend solely on probabilistic extrapolation without physical consideration of atmospheric limits (Rakhecha and Singh, 2010). Meanwhile, hydrometeorological methods, though physically realistic, require extensive meteorological data and complex modeling, introducing greater uncertainty (WMO, 2009; Seo et al., 2023). By balancing computational efficiency and physical representation, the Hershfield method effectively captures regional precipitation extremes, ensuring reliable PMP estimation for Chungcheongnam-do.
2.6 Spatial distribution mapping of extreme rainfall
Extreme rainfall for return periods (T5~T200) and PMP was spatially analyzed using the Inverse Distance Weighting (IDW) method in GIS. Annual maximum daily rainfall was derived from observations, with return period values estimated using the Gumbel distribution and PMP using the Hershfield method. Interpolated rainfall surfaces were classified into five vulnerability categories—very low to very high—using the Natural Breaks (Jenks) method. These maps depict spatial variability of extreme rainfall across the region. The Land Use and Land Cover (LULC) map was overlaid to identify agricultural areas exposed to different rainfall vulnerability classes.
3. Results
3.1 Average monthly rainfall
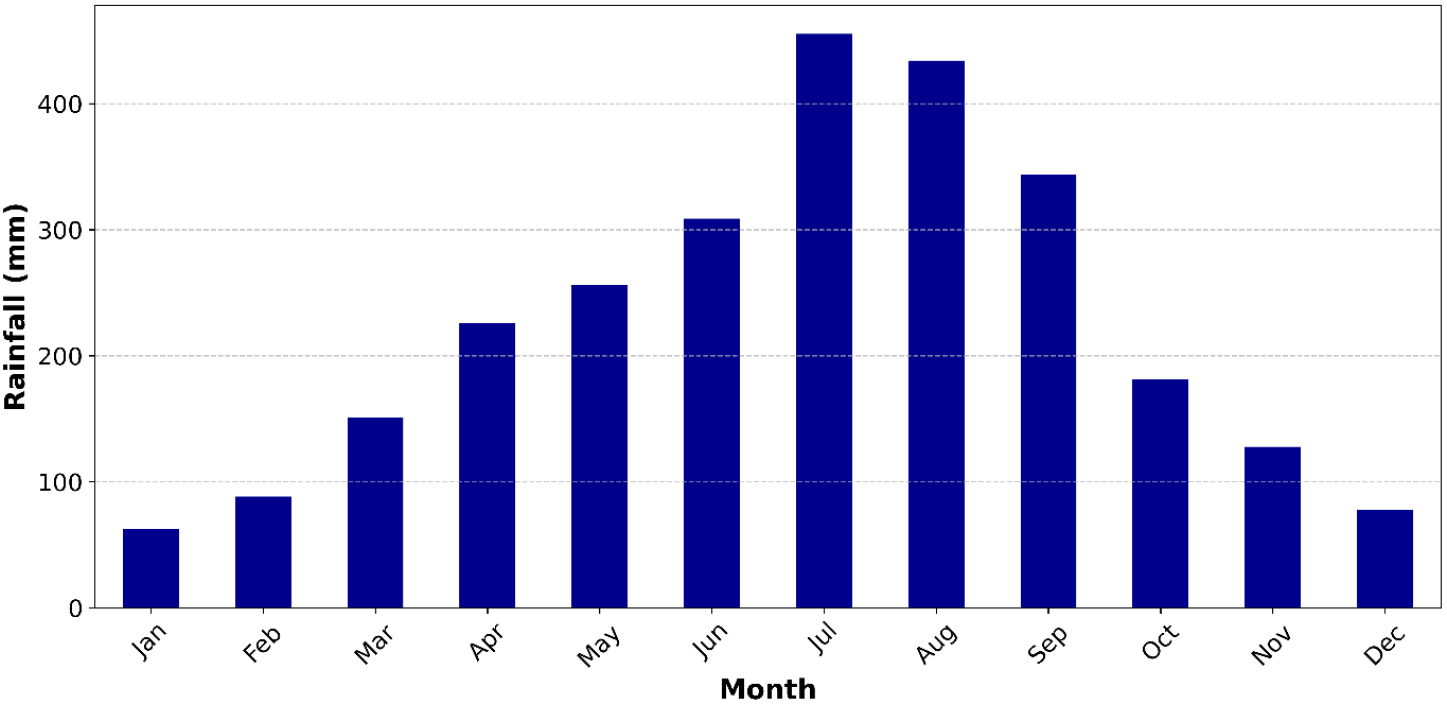
The average monthly rainfall pattern (Fig. 3) clearly exhibits a monsoon-dominated regime, primarily occurring between June and September. It is characterized by low rainfall during the winter months—62 mm in January and 88 mm in February—followed by a gradual increase from March (151 mm) to May (256 mm). Rainfall then rises sharply with the onset of the summer monsoon, reaching 309 mm in June and peaking in July at approximately 455 mm, while August also records substantial rainfall (434 mm). After this peak, rainfall begins to decline but remains relatively high in September (344 mm), before decreasing sharply from October (181 mm) to November (128 mm) and reaching its lowest level again in December (78 mm).
3.2 Returns period
Table 1 presents the rainfall depths corresponding to different return periods across multiple stations, ranging from 5 to 200 years. As expected, rainfall magnitude increases progressively with longer return periods at all stations, reflecting the statistical likelihood that more extreme rainfall events occur less frequently. Across the province, rainfall depths generally range from approximately 150~180 mm for shorter return periods (T5~T10) to over 350 mm at T200, depending on station location. For example, at Station 119, rainfall rises from 189 mm at T5 to 379 mm at T200, while Station 129 shows a similar trend, increasing from 162 mm to 303 mm. These consistent upward patterns across all stations confirm that extreme rainfall intensifies proportionally with return period, emphasizing the need to consider longer recurrence intervals in design and flood-risk analyses.
3.3 Flood-vulnerable areas based on multiple return period
Fig. 4 illustrates the spatial distribution of rainfall events exceeding threshold values for return periods ranging from 5 to 200 years, classified into five vulnerability levels: very low, low, moderate, high, and very high. Thresholds for each return period were derived from eleven rain gauge stations located within and around South Chungcheong Province.

At the 5-year return period (T5), rainfall exceedances range from 7 to 15 events. Very high vulnerability zones (13~15 events) are concentrated in the southeastern and southwestern sectors, while high vulnerability areas (10~13 events) extend toward the north. The central belt, particularly the mid-southern region, exhibits moderate vulnerability (9~10 events), with scattered low to very low zones across the central-southern region.
At the 10-year return period (T10), exceedances decrease to 3~7 events, with very high vulnerability confined to the southwest and high vulnerability appearing along the southeastern and northern edges. Moderate zones (4~5 events) occur mainly in central and southern regions, while low to very low areas dominate elsewhere. For the 15-year return period (T15), very high vulnerability clusters appear along the eastern and western margins, while the central interior shows moderate exposure and the northern zone remains less affected.
From the 20-year to 80-year return periods (T20~T80), exceedances continue to decline but become more spatially concentrated. Very high zones are localized in the southeastern interior and northern regions, surrounded by high and moderate vulnerability areas. At longer recurrence intervals (T100), persistent hotspots of very high vulnerability are observed in southern and southeastern areas, with moderate to high categories forming surrounding belts, while very low zones dominate the north and northwest. At the 200-year return period (T200), extreme rainfall vulnerability becomes most localized, confined to small southeastern and central pockets, whereas northern and coastal areas remain the least affected.
3.4 Assessing flood vulnerability of agricultural land under different rainfall return periods
Fig. 5 illustrates the exposure of agricultural land—comprising paddy fields, cropland, and mixed cropland-vegetation areas—in South Chungcheong Province under varying rainfall return periods (T5~T200). At shorter return periods (T5~T20), moderate vulnerability dominates. For T5, moderate exposure covers approximately 2,915 km2, largely from paddy fields (1,711 km2), while high and very high classes account for 408 km2 and 274 km2, respectively. At T10, the overall pattern remains similar, although very high vulnerability decreases to 219 km2. By T15, very high vulnerability expands sharply to 679 km2, with paddy fields contributing over half of the total, while moderate and high classes occupy 446 km2 and 330 km2, respectively. At T20, moderate vulnerability (1,831 km2) continues to dominate, followed by low and high categories.
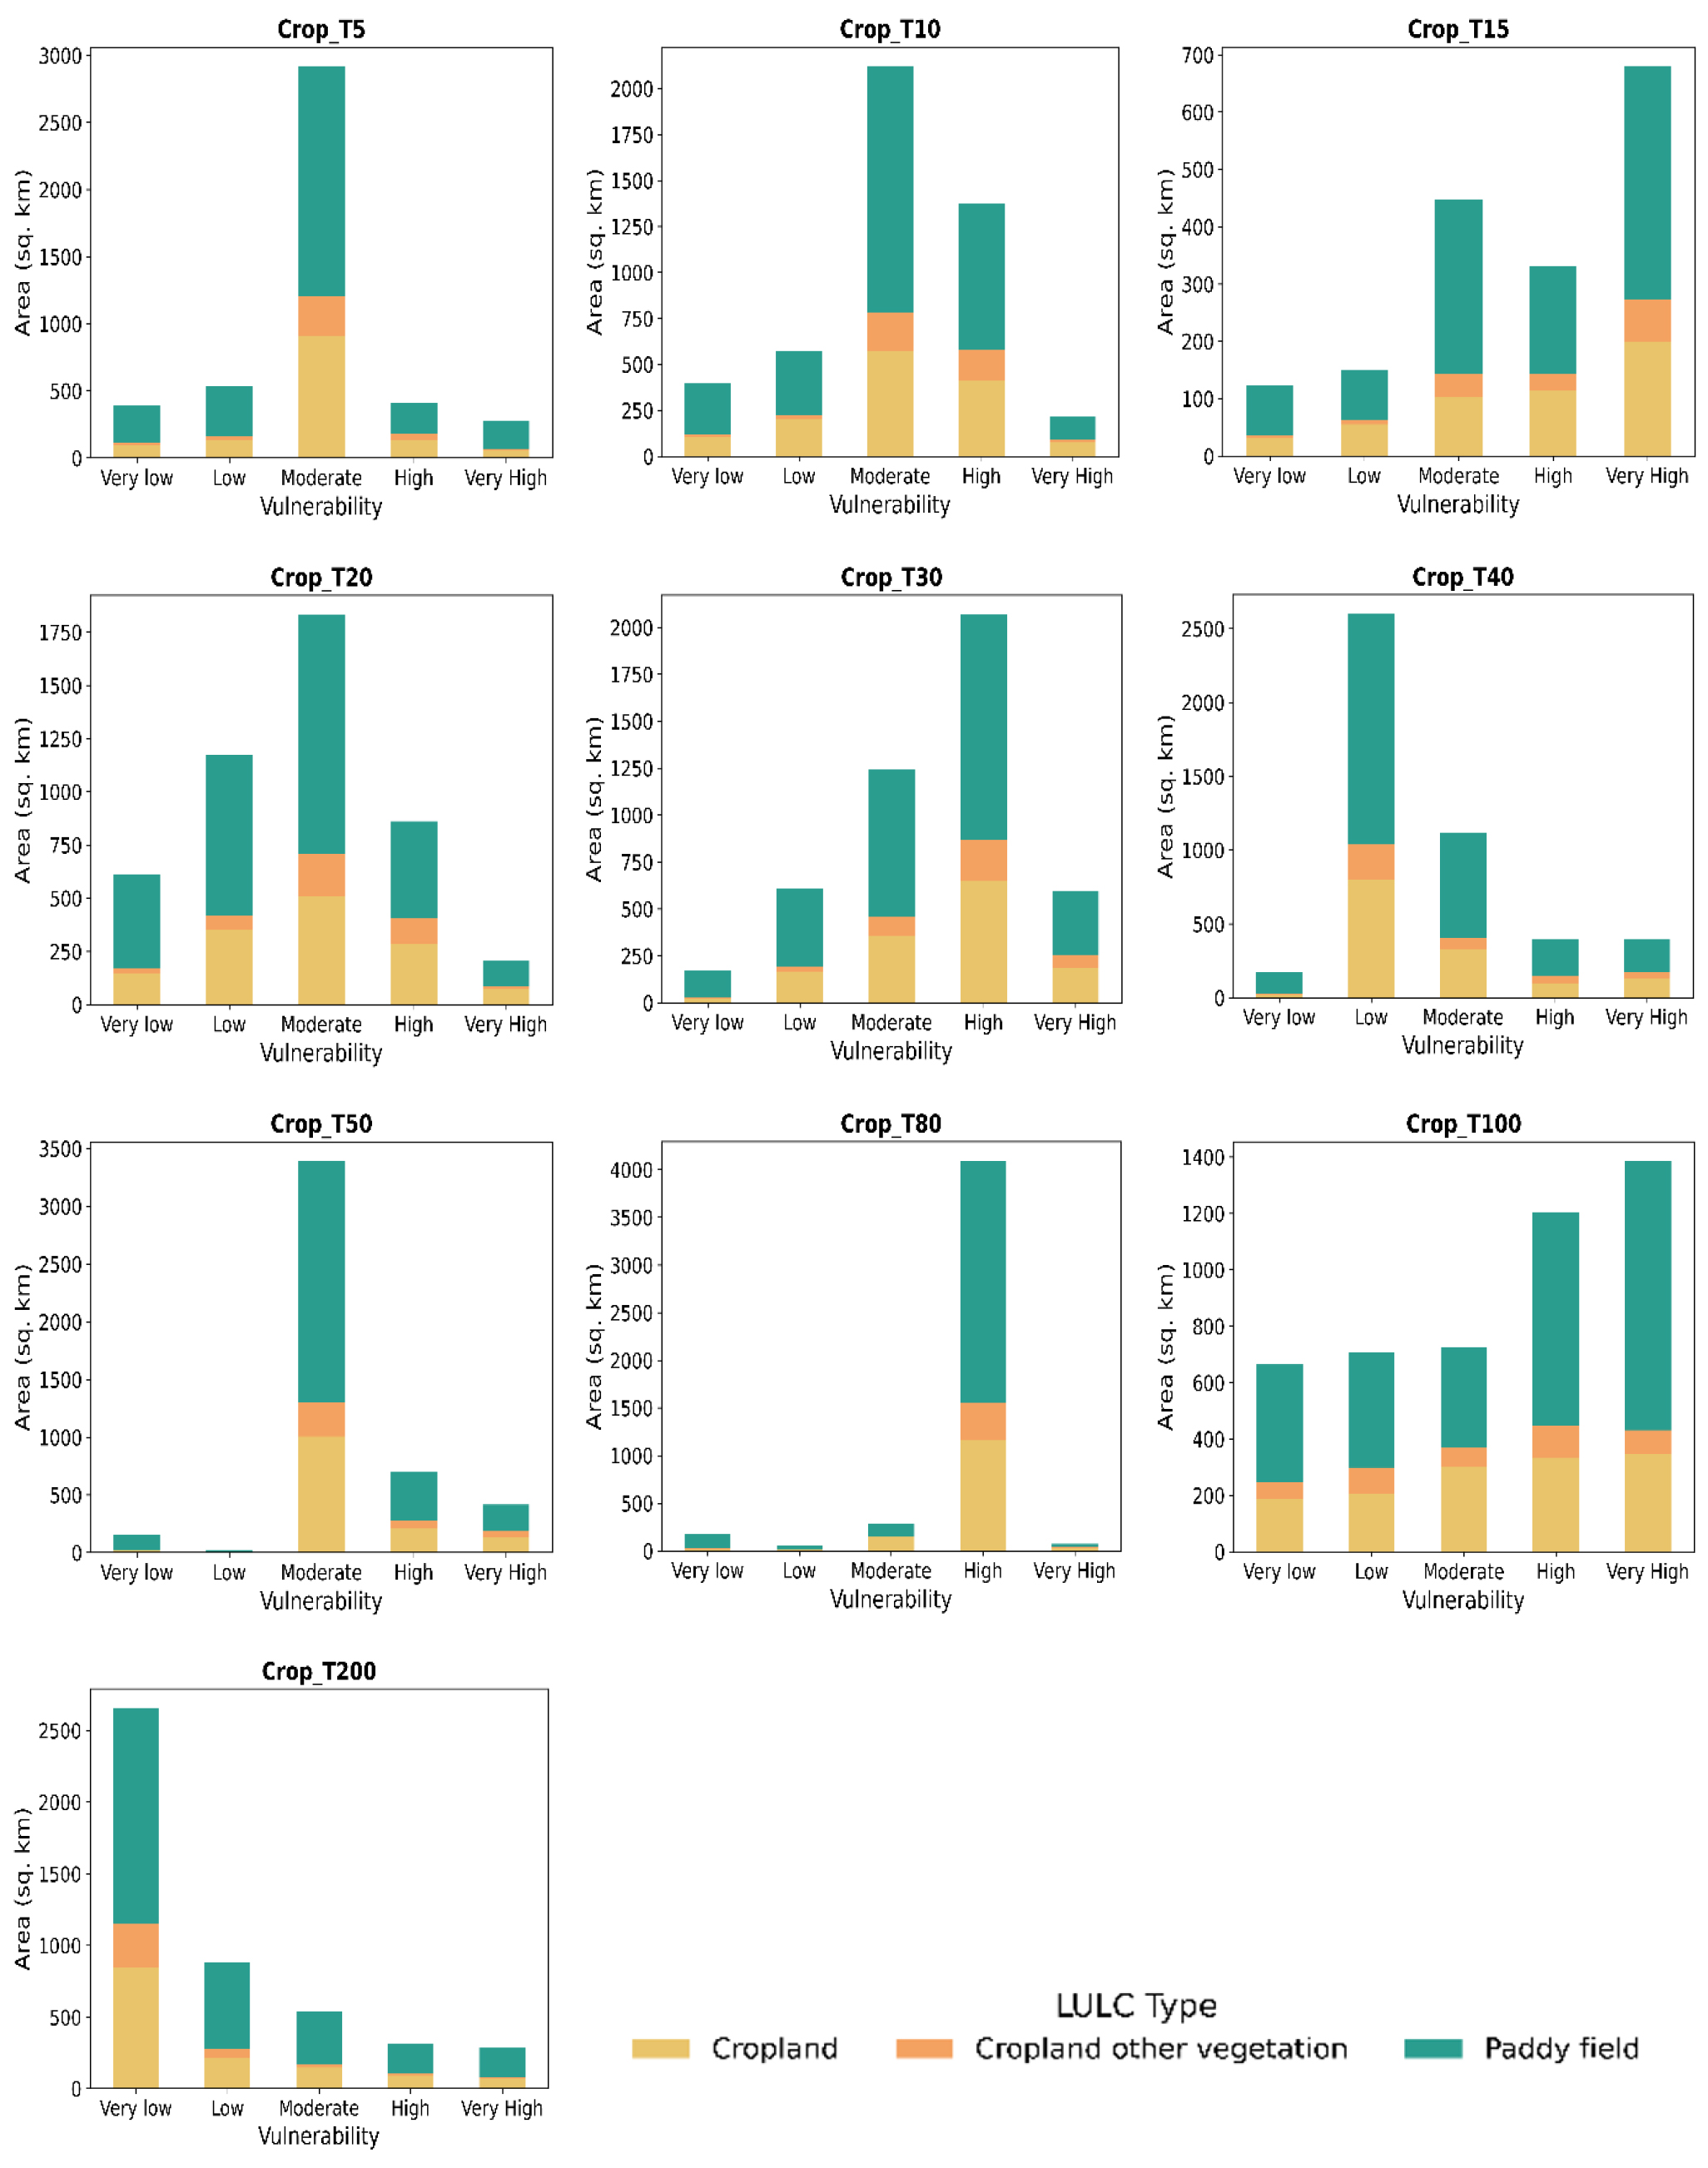
From T30 to T80, exposure gradually shifts toward higher vulnerability levels. At T30, high vulnerability becomes predominant (2,068 km2), mainly within paddy fields (1,200 km2). At T40, low vulnerability expands to 2,600 km2, while moderate vulnerability decreases slightly. At T50, moderate exposure increases substantially (3,388 km2), with paddy fields remaining the most affected land type. By T80, high vulnerability peaks at 4,089 km2, indicating intensified exposure across agricultural areas.
For longer return periods (T100~T200), vulnerability becomes more evenly distributed across categories. At T100, all classes—from very low to high—occupy roughly 664~ 1,385 km2 each, with paddy fields consistently dominant. Similarly, at T200, exposure shifts markedly toward very low vulnerability (approximately 2,658 km2), again dominated by paddy fields, while high (316 km2) and very high (283 km2) zones appear only as small, isolated patches.
3.5 Spatial distribution of PMP and areas classified by vulnerability rank
The spatial distribution of PMP exhibits a distinct regional gradient, with values ranging from 691 mm to 1,190 mm across the study area (Fig. 6). The northern and eastern zones are characterized by very low to low PMP values (691~894 mm), whereas the central region is dominated by moderate PMP levels (894.6~968 mm). In contrast, the southwestern sector displays the most critical conditions, with high (969~ 1,059 mm) and very high (1,060~1,190 mm) PMP values, indicating a pronounced susceptibility to extreme rainfall events.
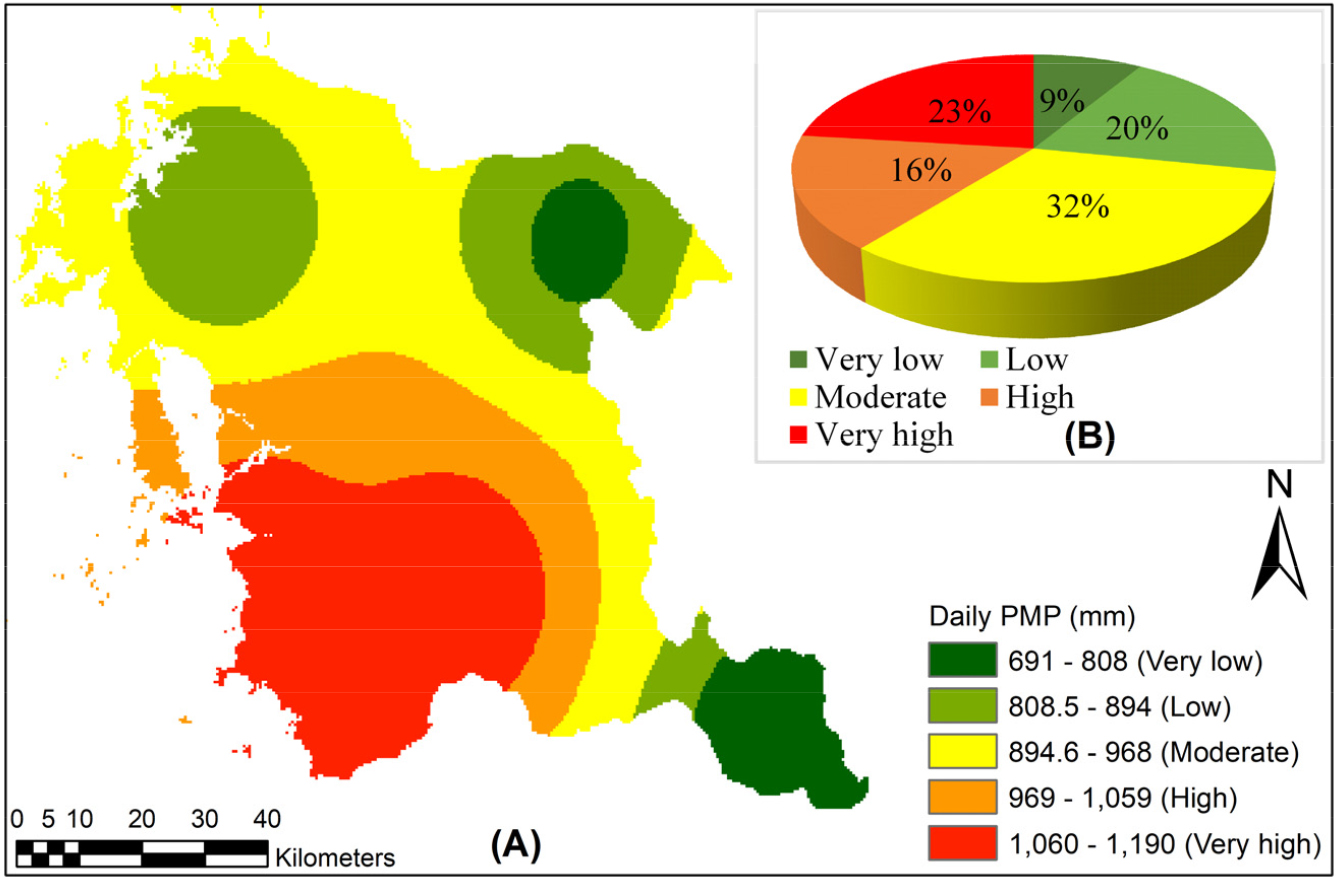
The areal distribution analysis (Fig. 6, pie chart) reveals that approximately 32% of the total area falls within the moderate vulnerability category, while 23% and 16% correspond to the very high and high categories, respectively. About 20% of the region is classified as low vulnerability, and only 9% lies within the very low category. Overall, nearly 39% of the study area is exposed to high to very high PMP conditions, emphasizing zones with elevated potential for extreme rainfall and associated flood hazards.
3.6 Vulnerability of agricultural land to flooding induced by PMP
The distribution of agricultural land across different PMP vulnerability classes highlights distinct exposure patterns for cropland, mixed cropland-vegetation areas, and paddy fields (Fig. 7). Paddy fields represent the most vulnerable category, exhibiting extensive coverage across all classes, particularly within the moderate (894 km2) and very high (832 km2) vulnerability zones. This pattern indicates that low-lying irrigated fields are highly susceptible to extreme rainfall events and resulting flood hazards.
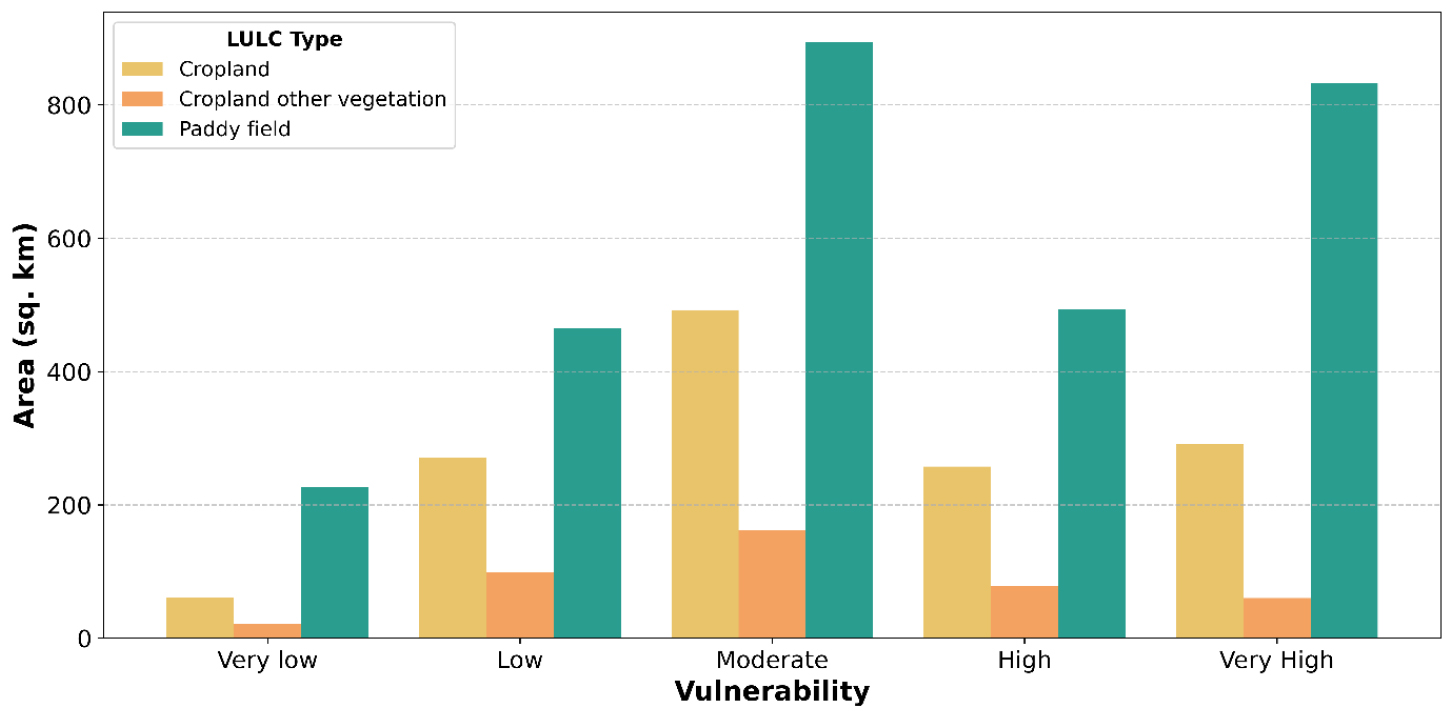
Cropland accounts for the largest share within the moderate (492 km2) and very high (291 km2) categories, suggesting that both moderately and severely exposed areas contain substantial portions of cultivated land. In contrast, mixed cropland-vegetation areas contribute comparatively smaller extents across all classes, peaking in the moderate vulnerability category (162 km2) and declining sharply in the higher categories.
4. Discussions
This study analyzed the spatial distribution of extreme rainfall under different return periods and probable maximum precipitation (PMP)—an approach commonly used in urban planning and river infrastructure management (Esteves, 2013; Morita, 2008; Sekaranom et al., 2021; Zischg et al., 2018). The results revealed that as return periods increase, the spatial extent of agricultural land exposed to flooding expands considerably. In particular, rice paddies and horticultural crop areas were identified as the most vulnerable, reflecting their concentration in low-lying regions and their high sensitivity to prolonged waterlogging. By incorporating both one-day extreme rainfall events and PMP, this study provides a comprehensive assessment that extends beyond conventional return period-based analyses.
The findings are consistent with previous research conducted in East and Southeast Asia, which also reported that agricultural land—especially paddy fields—is increasingly susceptible to extreme rainfall events (Redfern et al., 2012; Shrestha et al., 2019). However, unlike most earlier studies that focused primarily on historical return periods or projected climate change scenarios, the present study integrates PMP to evaluate upper-bound flood risks. This approach not only corroborates earlier findings but also provides new insights into the potential magnitude of future flood hazards under a changing climate.
Overall, the results underscore the growing inadequacy of traditional design standards, which tend to underestimate flood risks when based solely on shorter-duration or fixed-frequency rainfall assumptions in agricultural landscapes. Integrating PMP into flood risk assessments therefore offers a more robust framework for developing adaptive, climate-resilient strategies for agricultural water management. These findings further highlight the need to revise national drainage standards to reflect climate-induced rainfall intensification.
5. Conclusions
This study examined the spatial distribution of extreme rainfall events under various return periods and probable maximum precipitation (PMP) in South Chungcheong Province, South Korea. The results indicate that the majority of rainfall occurs between June and September, with peak rainfall concentrated in July and August. Spatial analysis revealed that the southern and northeastern regions are the most vulnerable under different return periods, whereas under PMP conditions, the southwestern region faces the highest flood risk, encompassing approximately 23% of the province’s total area. Across both return-period and PMP scenarios, paddy fields were identified as the most flood-prone land type, followed by cropland and mixed vegetation areas. These findings suggest the implications of extreme rainfall frequency and probable maximum precipitation (PMP) for Korea’s existing agricultural drainage design standards. Although the national design criteria were recently updated using rainfall frequency analyses, persistent agricultural flooding indicates that current standards still underestimate flood risks, as they rely on shorter-duration and fixed frequency rainfall assumptions. The study (Kim et al., 2023) demonstrated that future increases in extreme precipitation driven by climate change are likely to exceed the capacity of existing drainage systems in South Korea. Specifically, our study suggests revising design frequency thresholds, increasing drainage pump capacity standards, and updating return-period parameters based on PMP estimates to ensure sufficient discharge capability during extreme events. Incorporating PMP in assessing and sizing drainage systems would enhance their capacity to manage unprecedented rainfall events, thereby strengthening the climate resilience and long-term effectiveness of agricultural flood management in South Korea. Although this study primarily relied on rainfall data and spatial analysis without hydrodynamic modeling or field-based validation, it also limits a temporal inconsistency between the MODIS 2013 land use data and the 1973-2024 precipitation record. Future research should integrate multi-day rainfall events, expand the analysis to additional provinces, and evaluate the effects of climate change scenarios to enhance spatial accuracy and policy relevance.
